Hello everone,
I am using TASImages to display a whole load of greyscale images, which is working quite well. However, I recently noticed, that the creation of my TASImages takes a lot longer than expected.
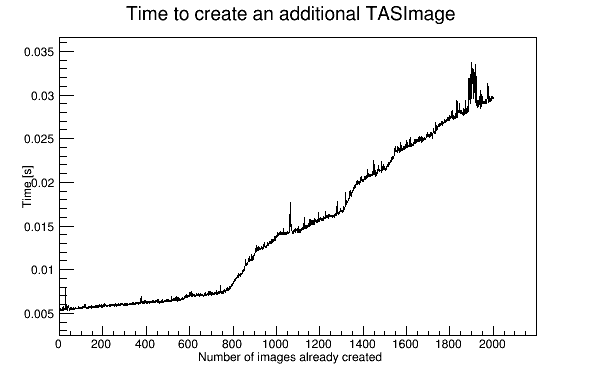
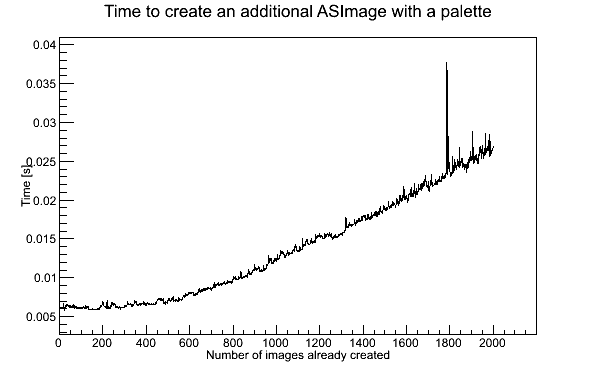
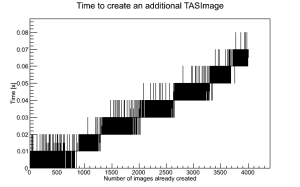
Maybe I am doing something wrong, or maybe this is a hardware related issue, but according to my data the time it takes to create a single TASImage depends on the number of TASImages I already have in memory.
This plot was generated by running the following code, which creates a lot of TASImages and measures the time used for each iteration:
[code]{
TBenchmark MyBenchmark;
TImagePalette *Colors = new TImagePalette(1, 0);
//Approximately 8GB of RAM, adjust Parameters if you run this on a machine with less RAM
UInt_t dimX = 512, dimY = 512;
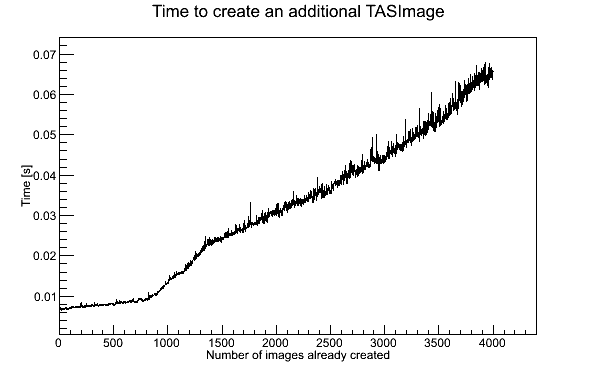
UInt_t Iterations = 4000;
Double_t *PixelArray = new Double_t[dimX * dimY];
for (UInt_t idx = 0; idx < dimX*dimY; idx++)
PixelArray[idx] = idx;
Double_t IterationTimes[Iterations], PlotXIndex[Iterations];
for (UInt_t idx = 0; idx < Iterations; idx++){
PlotXIndex[idx] = idx;
}
for (UInt_t idx = 0; idx < Iterations; idx++){
Double_t Zero = MyBenchmark.GetRealTime("Bench");
// Double_t Zero = MyBenchmark.GetCpuTime(“Bench”);
MyBenchmark.Start(“Bench”);
TASImage *img = new TASImage(“Test”, PixelArray, dimX, dimY, Colors);
MyBenchmark.Stop(“Bench”);
IterationTimes[idx] = MyBenchmark.GetRealTime(“Bench”) - Zero;
// delete img;
// IterationTimes[idx] = MyBenchmark.GetCpuTime(“Bench”) - Zero;
}
TCanvas *OutputCanvas = new TCanvas("Time per Iteration", "Time per Iteration", 600, 400);
TGraph *Graph = new TGraph(Iterations, PlotXIndex, IterationTimes);
Graph->SetTitle("Time to create an additional TASImage");
Graph->GetXaxis()->SetTitle("Number of images already created");
Graph->GetYaxis()->SetTitle("Time [s]");
Graph->GetXaxis()->CenterTitle();
Graph->GetYaxis()->CenterTitle();
Graph->Draw("APL");
}[/code]
I ran the example code via the root-interpreter, using root 5.34.02, but my original project was compiled with g++. The Computer used has 24GB RAM, so that shouldn’t be the issue.
root -l .x ~/Code/MinimalExample/MinimalExample.cxx++While I could use a workaround, where I don’t have to use as many TASImages at the same time, I think this issue is interesting enough to warrant some investigation, because I expected the time to be constant. Are there any explanations or possible solutions to this problem?
Additional Information:
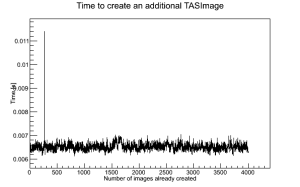
While measuring the CPU time is a more meaningful measurement, the plot is less readable.
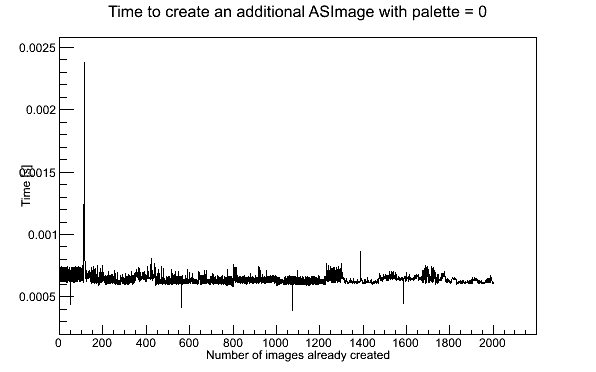
Also, if I delete each TASImage before creating the next one, everything behaves as expected and i get constant time.
tl;dr: why does it take longer to create an additional TASImage, if i already have a lot of them in memory?
MinimalExample.cxx (1.32 KB)