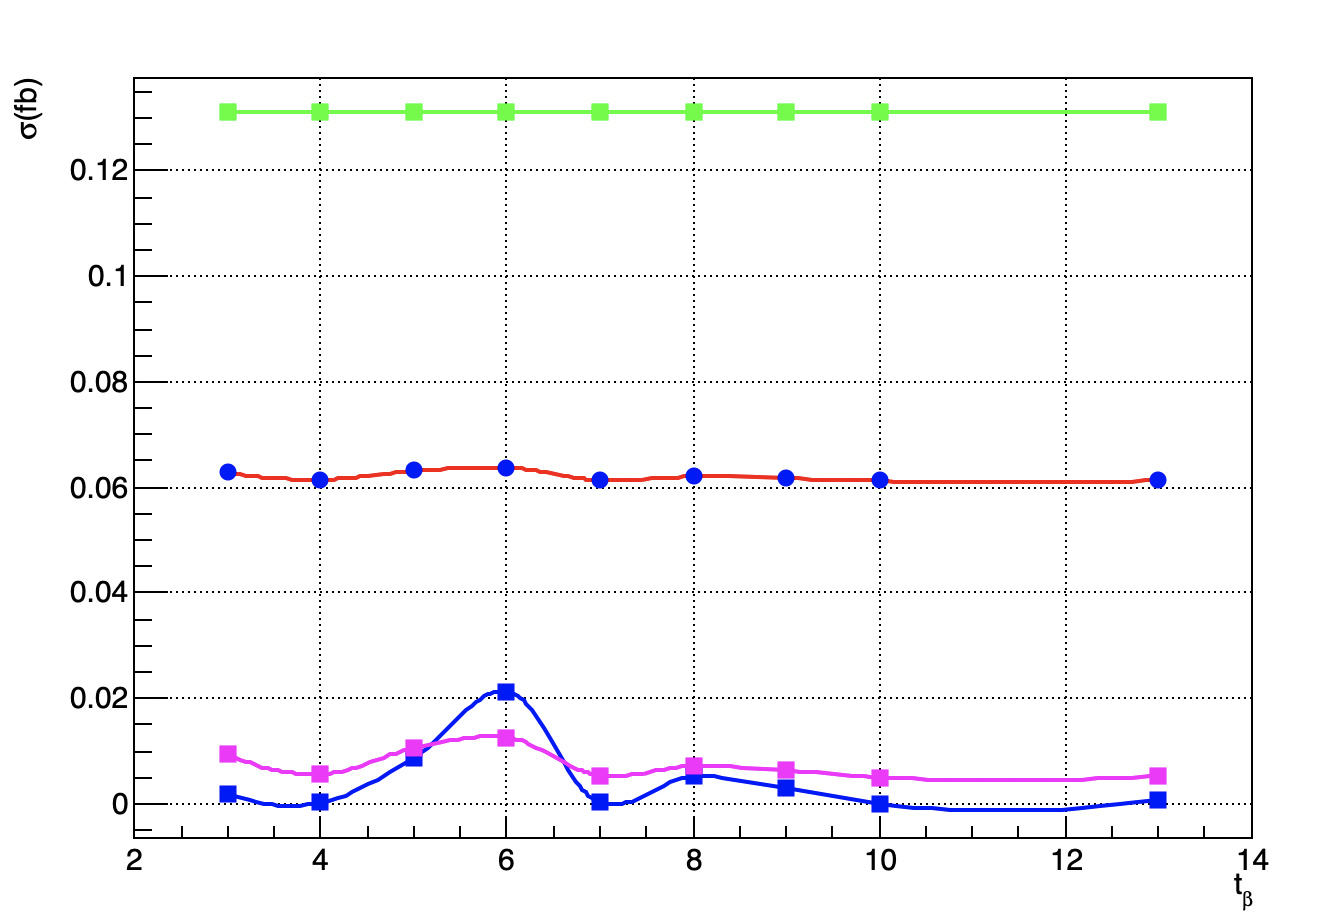
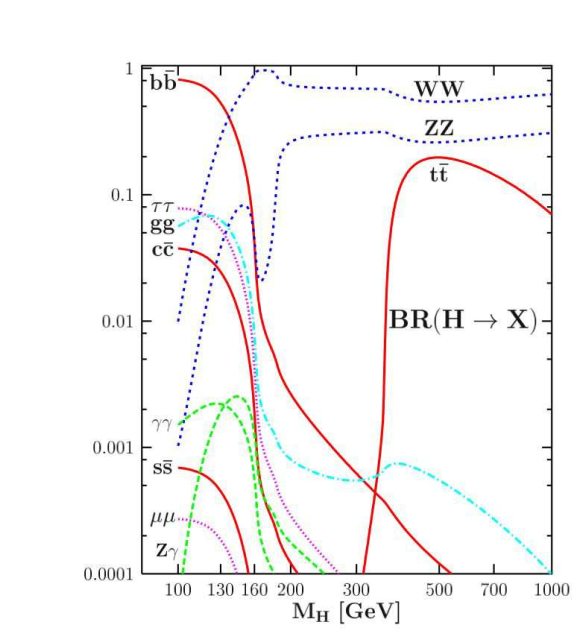
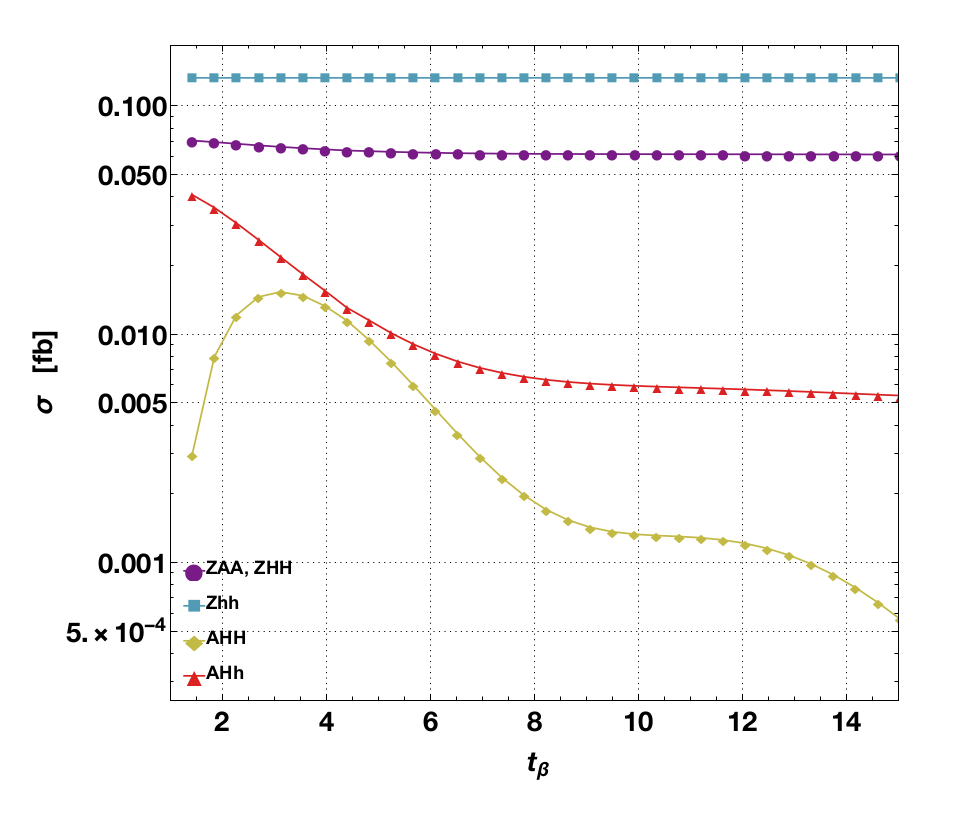
I want to tag a plots like did in the left bottom corner of attached plot. How can I make it possible?
I am using root_v6-14-06.My multigraph.C file is also attached.
multigraph.C (2.0 KB)
I want to tag a plots like did in the left bottom corner of attached plot. How can I make it possible?
I am using root_v6-14-06.My multigraph.C file is also attached.
multigraph.C (2.0 KB)
That right. Thats my results. I want to tag them like in above plot.
You need to add a TLegend.
Here is the macro in which I have added TLegend. In this plot I want to remove border of TLegend box but when I do this then gridlines disappear. How to fix it?
   legend->SetLineWidth(0);
   legend->SetFillStyle(0);
   legend->Draw();
It fix my problem. There one thing more as in figure shared in first comment there is not x and y limit showing at origin. How to do this?
You can change the lower limits of both axis so that the optimiser will drop the first label or use
I am not sure to understand what you mean by “tag plots” ? you mean adding a legend ?
Yes, but just like in attached file
Add a TLegend in the macro producing this plot.
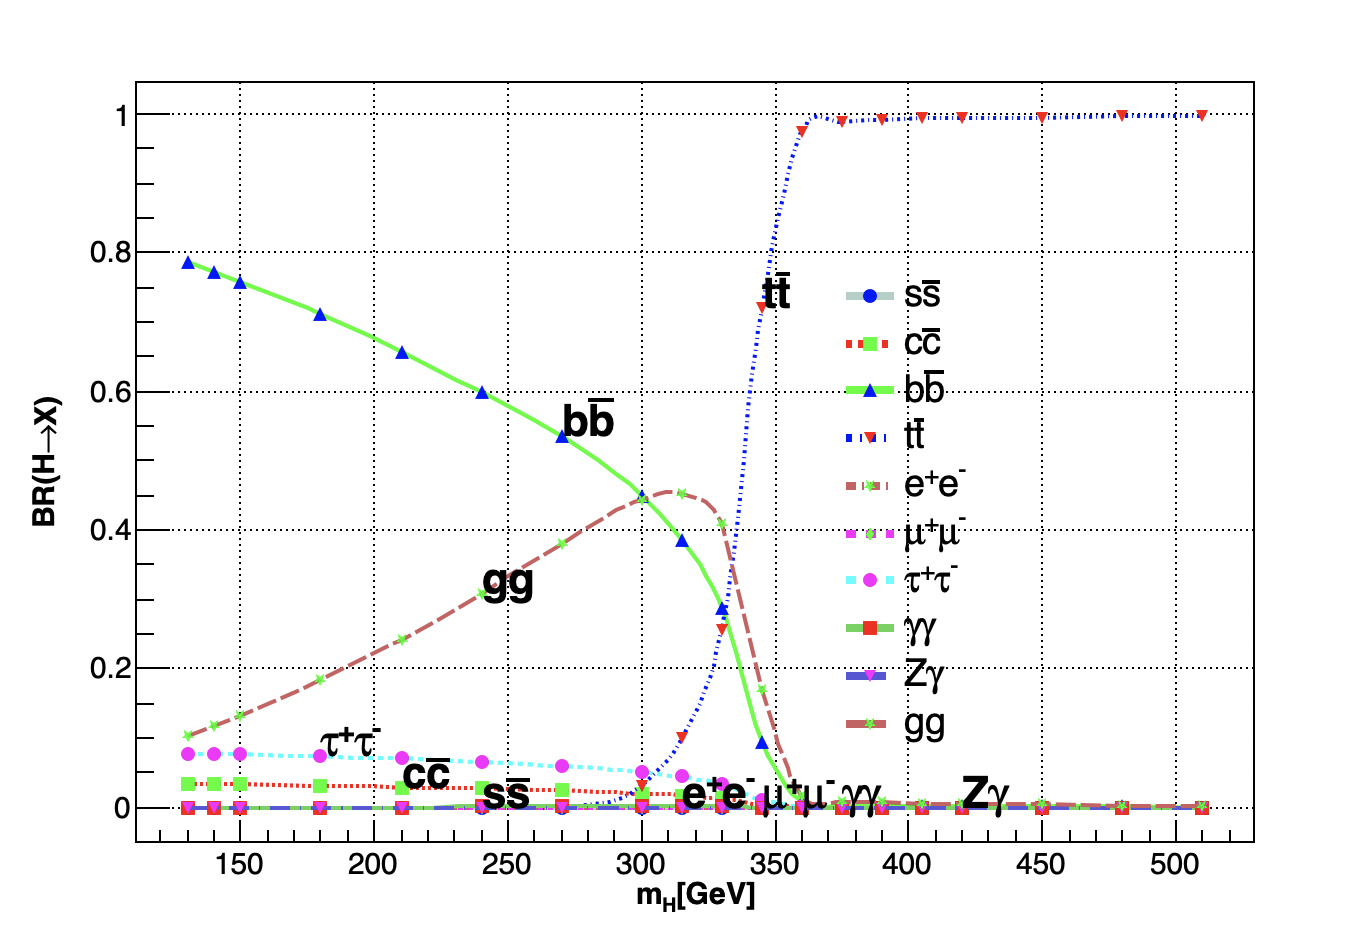
But in Tlegends dicussed above there is only one Tlegend title box appearing at top corner and here are tags for each plots at any location.And also my Tlegends title box does not move in all canvas. It just move in half canvas. Here is my macro. could you please make required additon?
multigraph.C (7.1 KB)
Here it is. DrawTag draws the tag next to the point number ì (2nd parameter) of the graph g. Change i to change the tag position. multigraph.C (6.9 KB)
Adjust DrawTag to improve the tag look (if needed).
This topic was automatically closed 14 days after the last reply. New replies are no longer allowed.