Dear experts,
could you please also help me understand another feature of p0(mass) calculated by the AsymptoticCalculator, which is unexpected to me?
It looks as if the p0 values even far outside the peak area get ‘scaled down’ in the presence of a peak.
In a toy example I’m comparing p0(mass) calculated twice on the SAME sample of background events, either adding to it or not adding some signal.
example_p0.py (7.8 KB)
-
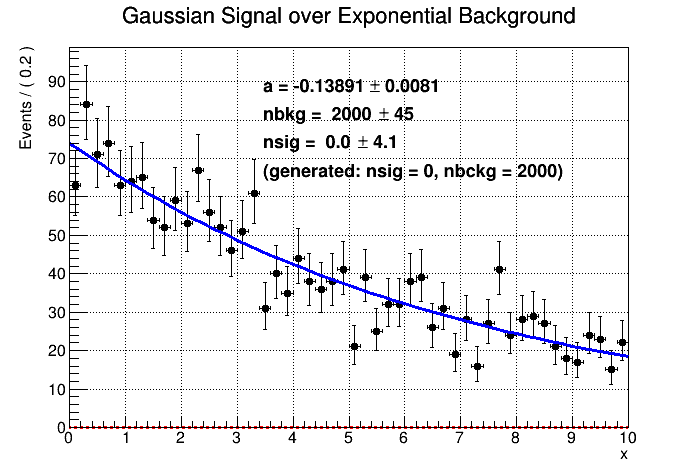
The first two plots show generated Gauss+Exp distribution with 0 signal events, and corresponding p0(mass).
-
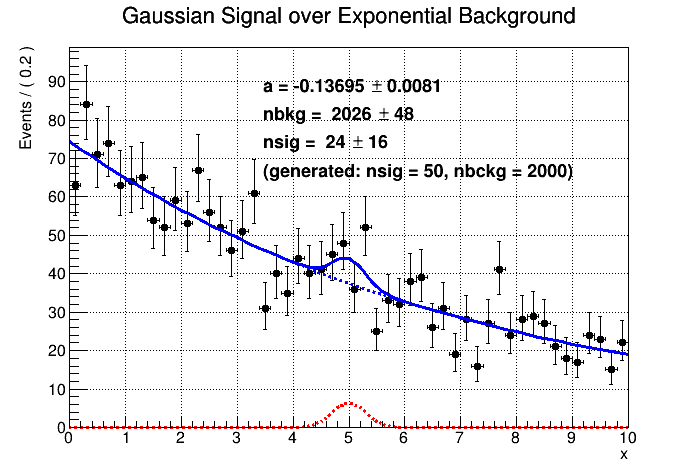
The following two plots show the same distributions, in case of adding 50 signal events at mass = 5.0 .
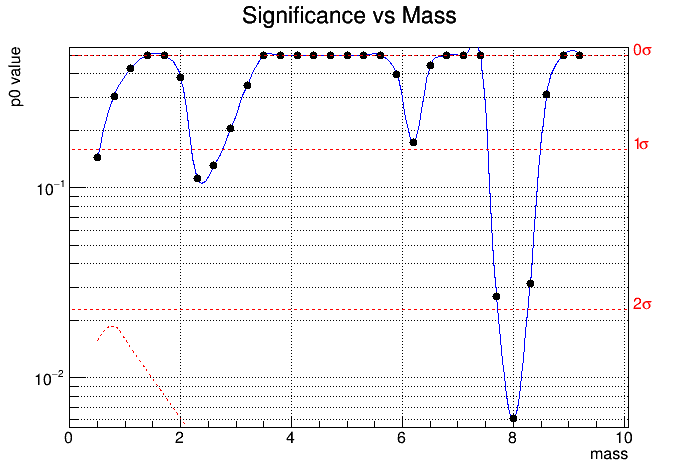
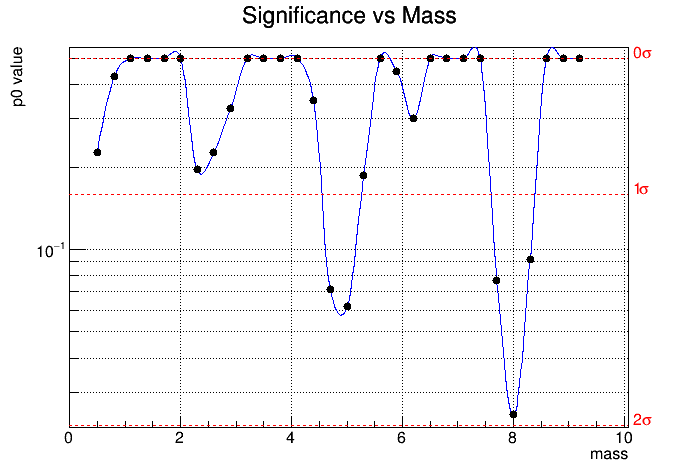
Isn’t it surprising, that although by eye the points outside mass ~ 5.0 scatter pretty much the same around the best fit curve (which is in both cases Gauss+Exp), the resulting p0 have significantly different scales?
(Given a different random seed, some of the smaller peaks can even go down to p0 = 0.5 and thus disappear altogether…)
Is this behaviour expected? Why addition of a small peak induces visible changes over the whole mass range?
I thought it calculated local p0, what am I doing wrong?
Many thanks in advance for any help!
Best regards,
Dima.
PS: Calculation of the p0 with AsymptoticCalculator was borrowed from p0Plot.C example from the RooStats tutorial, Exercise 6b
https://twiki.cern.ch/twiki/bin/view/RooStats/RooStatsExercisesMarch2015#Exercise_6b_Compute_significance
PPS: The ROOT version is 6.28.00-a8528