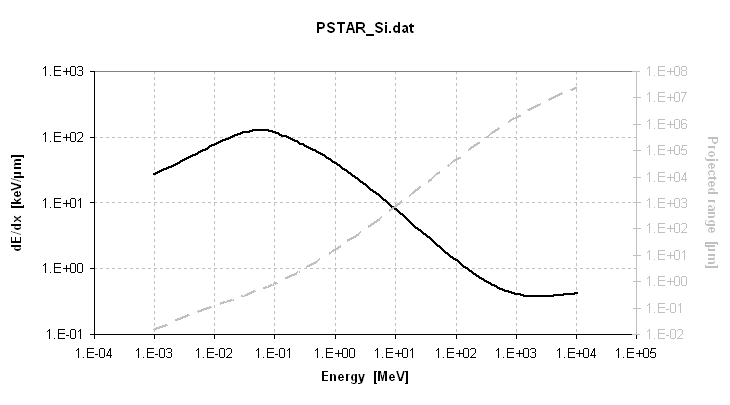
I’d like to superimpose two TGraphs with different y log scales like in “dEdx_excel.png”.
The method given in the manual with the scale method does not seem appropriate because of the y log scale.
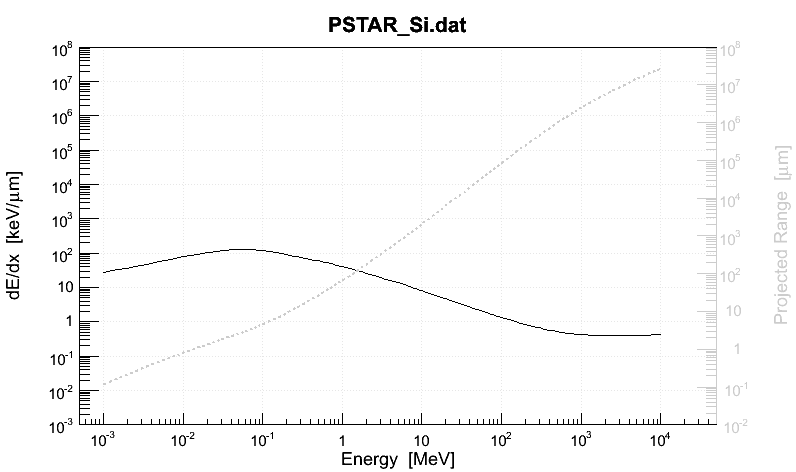
For the time being I’m stuck with my “dEdx_root.png”.
How should I proceed ?
Also, is there a way to rotate a TGAxis ?
For TAxis, one can use RotateTitle().
Thanks René for your fast answer.
These examples are the same as in the manual.
The scale method does not work in log scale since it makes the plot go up or down, whereas it would need to be “compressed”.
I still have no idea about how to rotate a TGaxis.
Thanks, M
TGaxis is a graphics primitive drawing an axis in the 2D plane. The TGaxis constructor has four parameters (among others) defining the axis position (1st point and 2nd point). Therefore the axis can be positionned anywhere there is not need for “rotation”.
Sorry, I was talking about the title attached to a TGaxis.
TGaxis *axis = new TGaxis(xmax,ymin,xmax,ymax,wmin,wmax,510,"+G") ;
axis->SetTitle("Projected Range  [#mum]") ; axis->CenterTitle() ;
//axis->RotateTitle() ; // ???
How to rotate it ?
For a TAxis, one just needs to use RotateTitle()
myHistogram->GetXaxis()->RotateTitle() ; I haven’t found anything similar for TGaxis.
Thanks, M
PS: Is my problem about the superimpostition of graphs/histos with different y-logscales clear enough ?