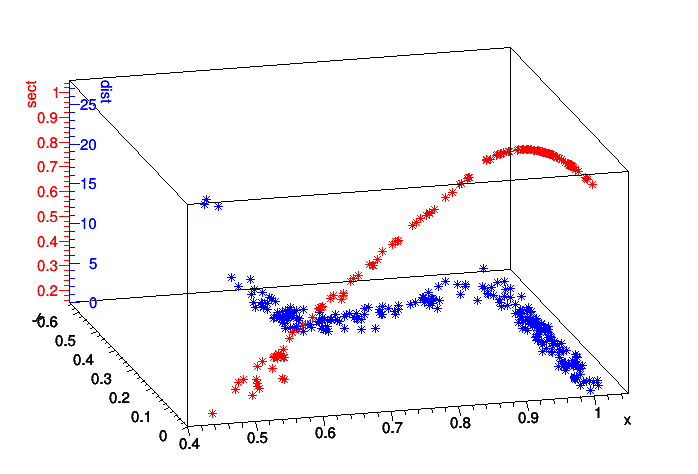
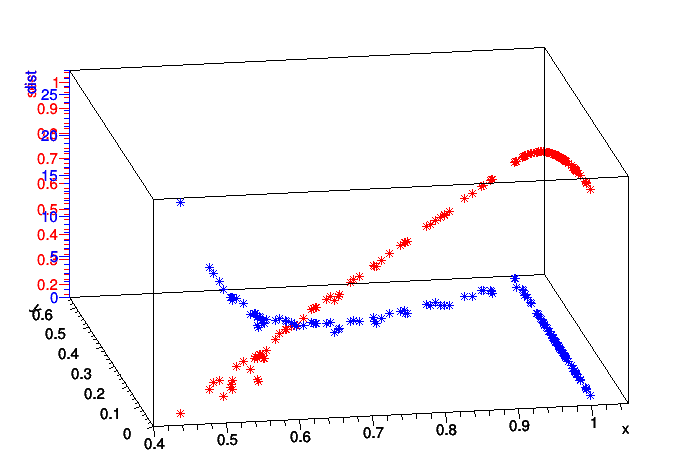
I’ve been searching through documentation and I’ve haven’t found a clue for my peculiar problem : i’d like to superimpose two TH3 on the same plot with different scale. Using the transparent pad tip is working well but what I’d like to tune now is the position of the my Z axis (as they are different for both plot). Is this possible ?
I’m joining a mwe (a macro + input file) and the plot that I obtained so far (where both colored axis are superimposed).
thanks but nope: in the twoscale example, a TGaxis is created, once the x1, x2, y1 and y2 coordinates are provided. This does not take into account the angle from which we observe (Theta and Phi)
I’ve tried to adapt this computing these values using
and Theta and Phi, restraining their revolution range at [0,90], but this has never converged as I wanted (i can provided another macro).
The Z axis is always on the most left side of the box. It cannot be move on an other side. The solution you got is good. You could also shift the labels so they do not overlap.
 ), in case someone else is struggling with this.