Hello,
I have a series of histograms that need to be added then subtracted in the final plot so I did following things
TCanvas* c6 = new TCanvas(“c6”, “”, 50, 50, 1000, 1000);
c6->Divide(2,2);
if(c6){
c6->cd(1);
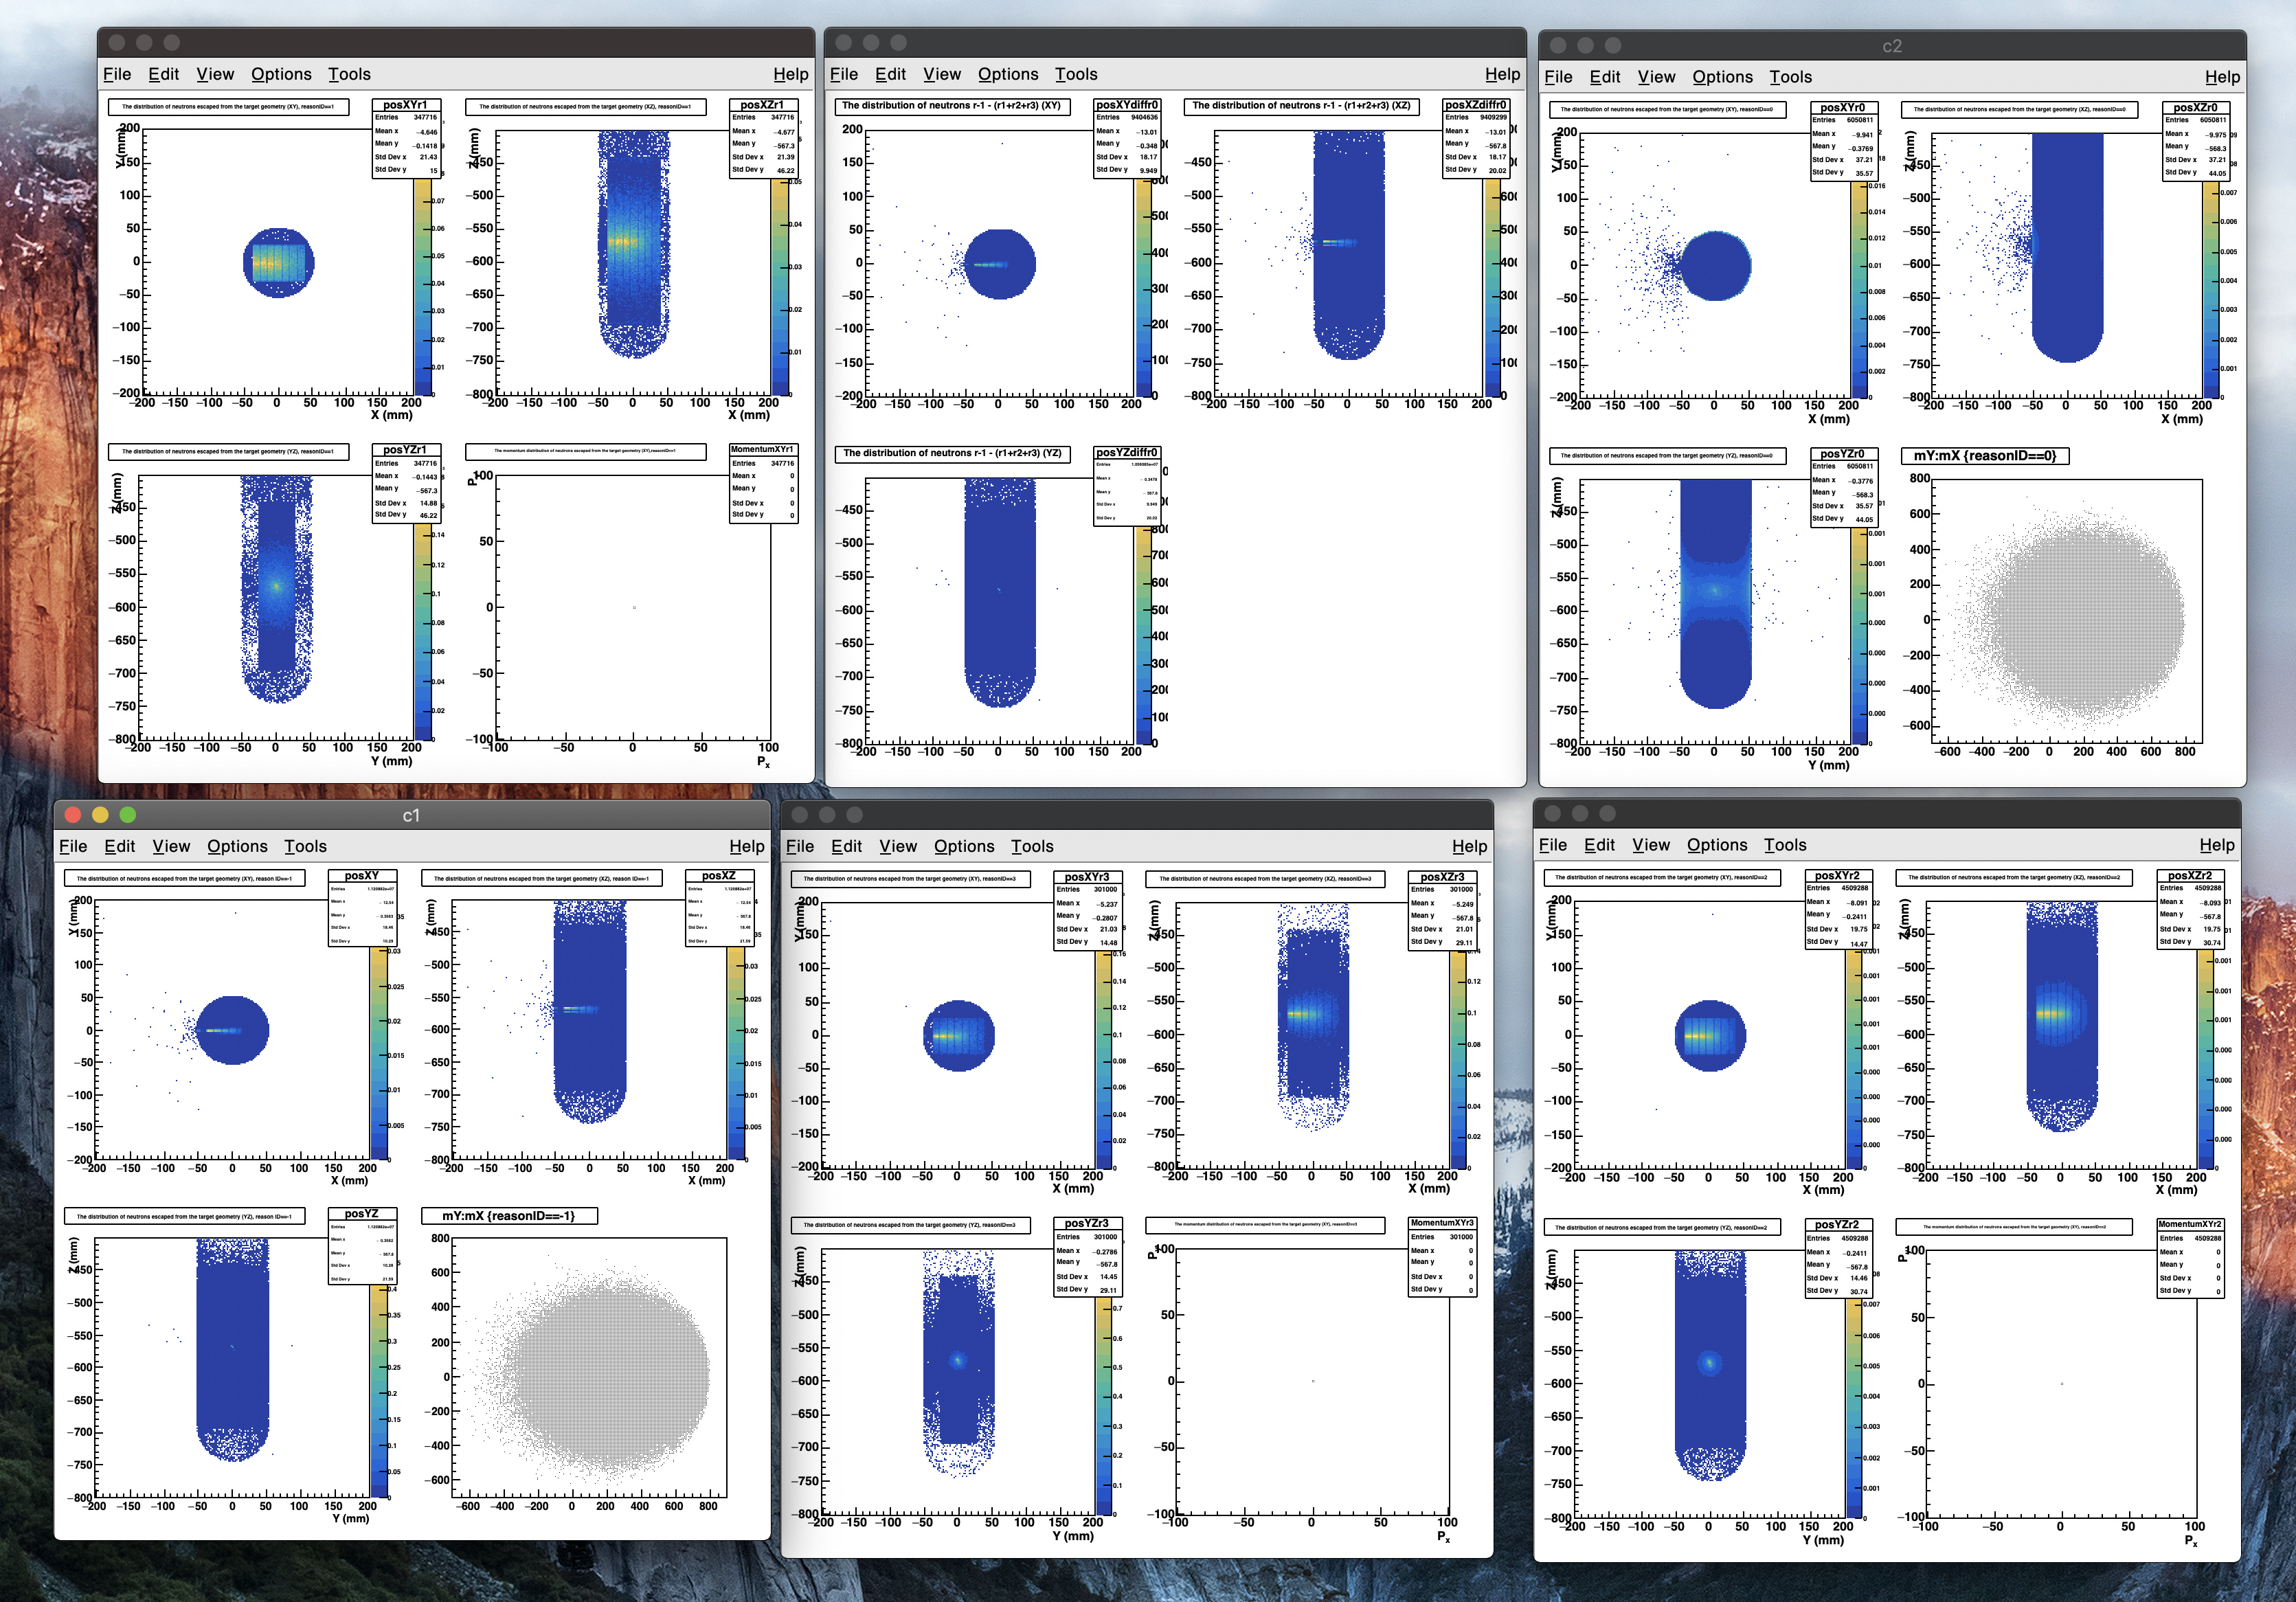
TH2F *posXYdiff12 = new TH2F(“posXYdiff12”, “The distribution of neutrons escaped from the target geometry (XY), r1+2”, 401, -200.5, 200.5, 401, -200.5, 200.5);
EverythingN->Draw(“NPosY:NPosX>>posXYdiff12”, “reasonID==1”,“COLZ1”);
posXYdiff12->Add(posXYr2,1);
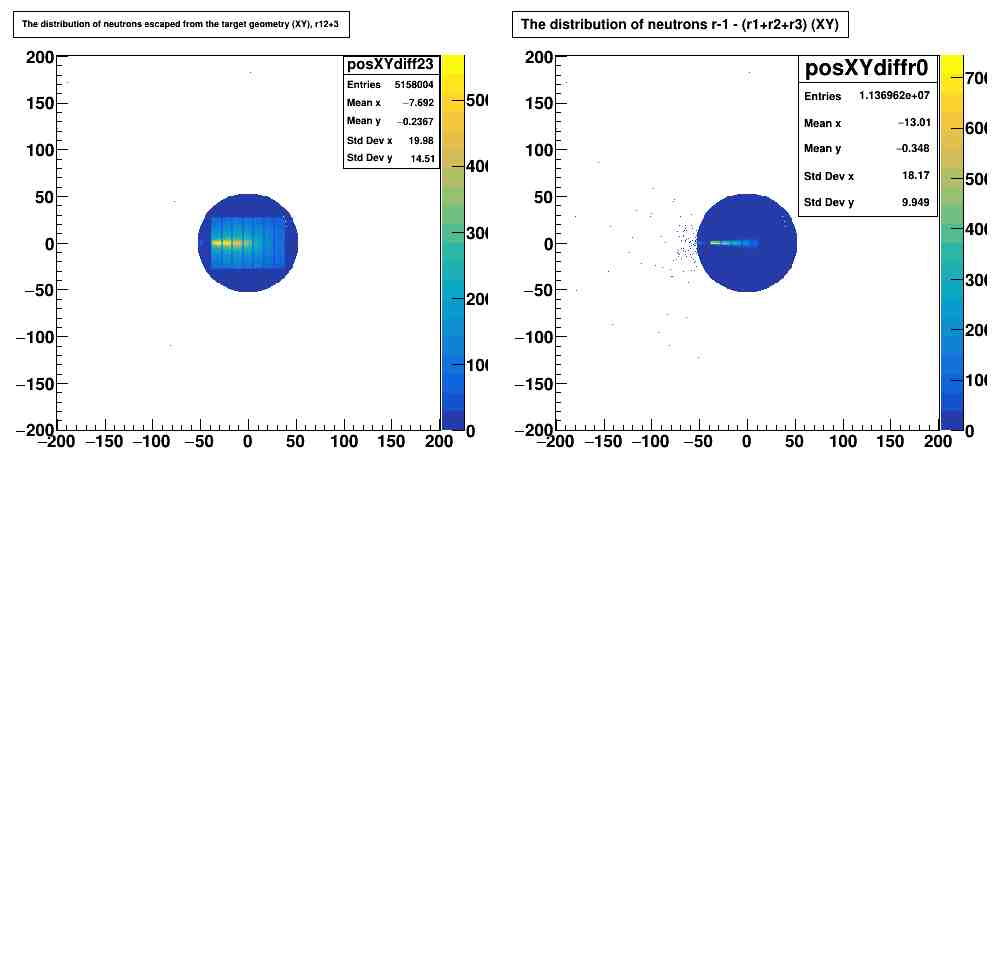
TH2F *posXYdiff23 = new TH2F(“posXYdiff23”, “The distribution of neutrons escaped from the target geometry (XY), r12+3”, 401, -200.5, 200.5, 401, -200.5, 200.5);
EverythingN->Draw(“NPosY:NPosX>>posXYdiff23”, “reasonID==3”,“COLZ1”);
posXYdiff23->Add(posXYdiff12,1);
c6->cd(2);
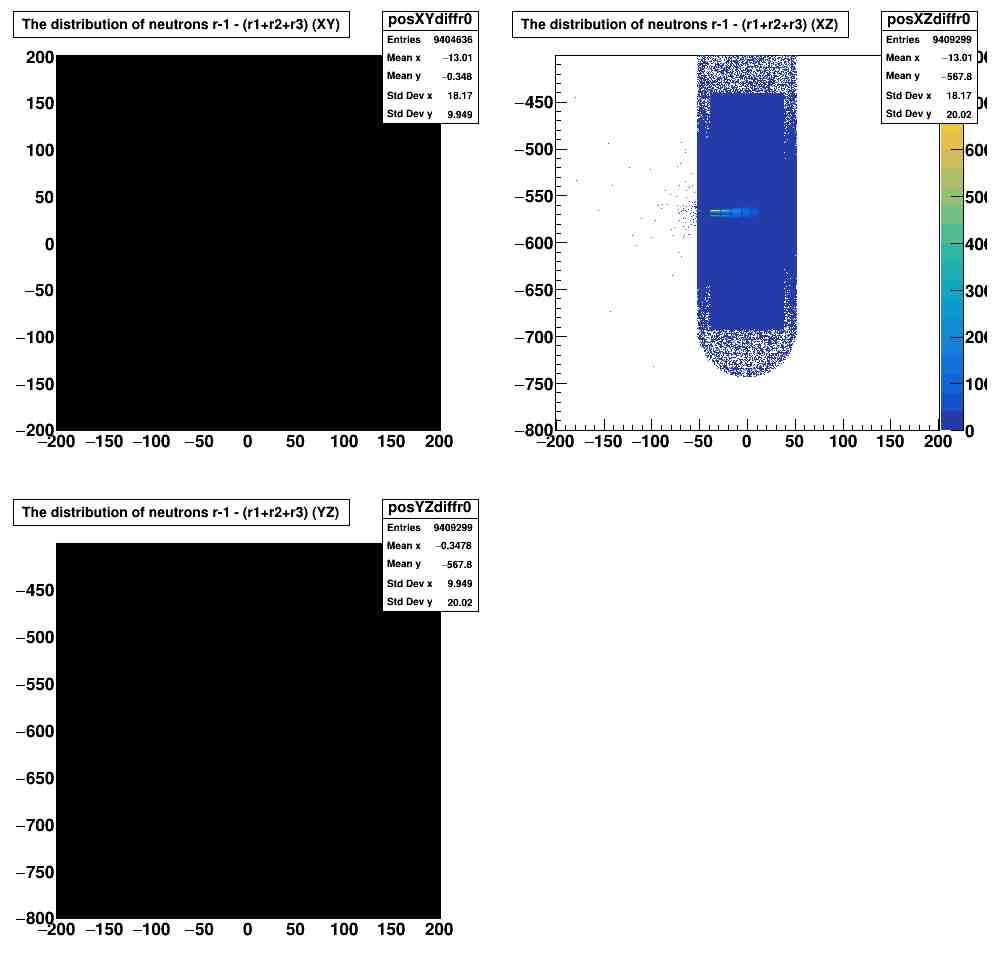
TH2F *posXYdiffr0 = new TH2F(“posXYdiffr0”, “The distribution of neutrons r-1 - (r1+r2+r3) (XY)”, 401, -200.5, 200.5, 401, -200.5, 200.5);
EverythingN->Draw(“NPosY:NPosX>>posXYdiffr0”, “reasonID==-1”,“COLZ1”);
posXYdiffr0->Add(posXYdiff23,-1);
Up to the point where cd(1), the plot is correct. However, when I did the subtraction, the number of entries are not matched up. If it is subtracting from posXYdiffr0, the number of entries showing in stat, should be 6050816.
I believe that the subtraction is not taking from the addition of reason id 1, and 3.
I really appreciate if you can help.
Thank you