Hi!
I’m trying to substract two histos from each other and expect a distribution around zero with positive and negative values.
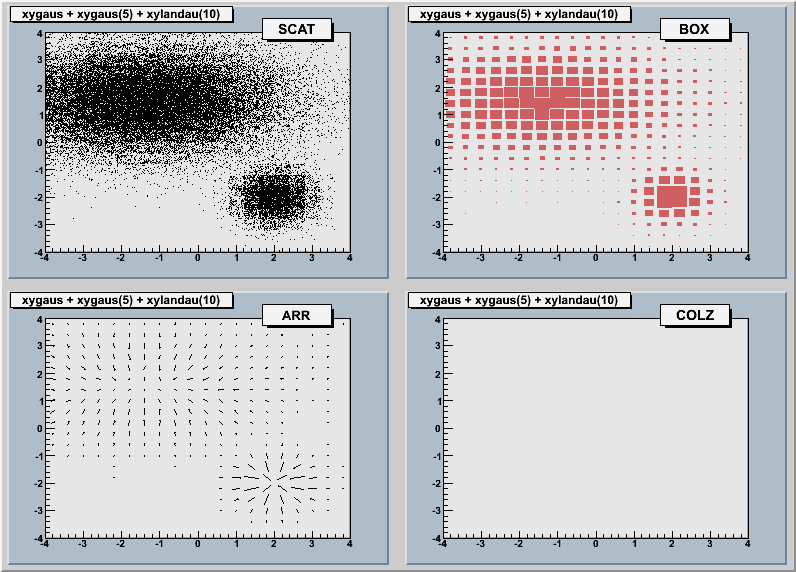
To show how I am doing it I adapted tutorials/draw2dopt.C:
{
// display the various 2-d drawing options
gROOT->Reset();
gStyle->SetOptStat(0);
gStyle->SetPalette(1);
gStyle->SetCanvasColor(33);
gStyle->SetFrameFillColor(18);
TF2 f2 = new TF2(“f2”,“xygaus + xygaus(5) + xylandau(10)”,-4,4,-4,4);
Double_t params[] = {130,-1.4,1.8,1.5,1, 150,2,0.5,-2,0.5, 3600,-2,0.7,-3,0.3};
f2.SetParameters(params);
//change to pointers
TH2F h2 = new TH2F(“h2”,“xygaus + xygaus(5) + xylandau(10)”,20,-4,4,20,-4,4);
TH2F* h22 = new TH2F(“h22”,“xygaus + xygaus(5) + xylandau(10)”,20,-4,4,20,-4,4);
h2->SetFillColor(46);
h2->FillRandom(“f2”,40000);
// fill by random, so I expect a distribution around zero from substracting
h22->FillRandom(“f2”,40000);
TPaveLabel pl;
//basic 2-d options
Float_t x1=0.67, y1=0.875, x2=0.85, y2=0.95;
Int_t cancolor = 17;
TCanvas c2h(“c2h”,“2-d options”,10,10,800,600);
c2h.Divide(2,2);
c2h.SetFillColor(cancolor);
c2h.cd(1);
h2.Draw(); pl.DrawPaveLabel(x1,y1,x2,y2,“SCAT”,“brNDC”);
c2h.cd(2);
h2.Draw(“box”); pl.DrawPaveLabel(x1,y1,x2,y2,“BOX”,“brNDC”);
c2h.cd(3);
h2.Draw(“arr”); pl.DrawPaveLabel(x1,y1,x2,y2,“ARR”,“brNDC”);
c2h.cd(4);
// change here
h22->Add(h2,-1.);
h22->Draw(“colz”); pl.DrawPaveLabel(x1,y1,x2,y2,“COLZ”,“brNDC”);
c2h.Update();
// see the canvas begin_html c2h end_html
}
Note how the last Draw() is not successful (or is it just a palette problem? See attached png)
With the event status i can see how the resulting histogram has actually expected values, but it is not drawn.
If I’m doing something wrong with the palette, please tell me what, I tried already a lot with redefining new palettes and contour levels but all to no avail. 
Cheers,
Michael
PS.: CVS ROOT updated today, on Kubuntu Linux (updated today 
Edit: Trying out more, it’s interesting to see, that only substracting with factor -1. makes a problem. -1.00001 works fine, also -0.95 and -1.05.
So is -1. not allowed? If so, why not? How else would one test errors/deviations between distributions?