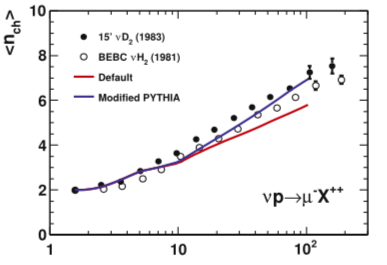
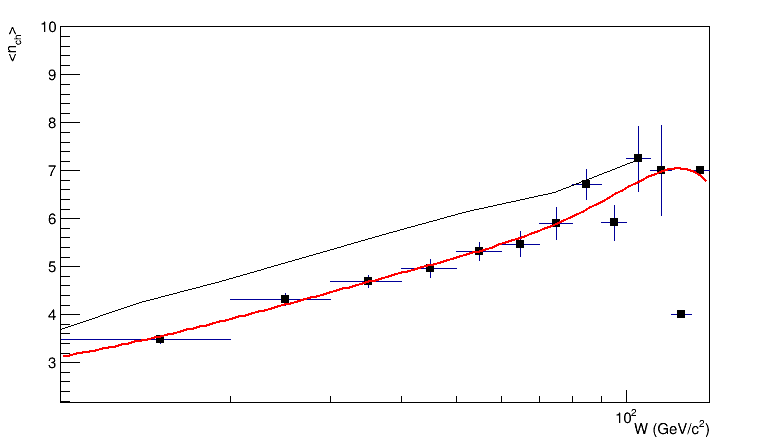
which is labelled ‘correct’. However, when I use “canvas->SetLogx()”, the X-axis becomes logged but not in the way I would like.
I’ve been recommend to try to bin my data logarithmically but I’m not sure where to start with doing this. Is there an easier way of manipulating the x-axis to achieve this.
I’ve defined as starting from zero using:
TProfile* prof = new TProfile(“prof”, “prof”, 14, 0, 140 );
EDIT:
I’ve just changed in to a negative value and I observe the scale I want - Thanks for the quick help. Although if you can explain why this fixes it, that would be helpful.