I’m making some plots in a simple macro which just takes a histogram from a file, formats it and saves it as a pdf. For some reason when I do this, my plots end up with white stripes on them when I save them, but not when I look at them in the interactive root session. Can someone tell me why and how to solve this?
I’m using ROOT 6.26.06_1 on MacOS Ventura 13.3.1.
Here’s the code:
  TCanvas *c1 = new TCanvas("c1","c1",900,700);
  TH1F* h1 = (TH1F*)_file->Get("dir/hist");
  h1->Draw("HISTO");
  h1->SetStats(0);
  h1->SetFillColor(kBlack);
  h1->SetLineColor(kBlack);
  h1->SetLineWidth(2);
  h1->SetFillStyle(3001);
  h1->SetTitle(";PVetoChID+EVetoChID;#Events");
  h1->GetYaxis()->SetTitleOffset(1.35);

  c1->SetRightMargin(0.025);
  c1->SetLeftMargin(0.09);
  c1->SetTopMargin(0.02);
  c1->SetBottomMargin(0.075);
  c1->SetBorderMode(1);
  c1->SetHighLightColor(0);
  c1->Modified();
  c1->Update();

  c1->Print("/Path/To/Save/Name.pdf");
This is what it looks like in the interactive session:

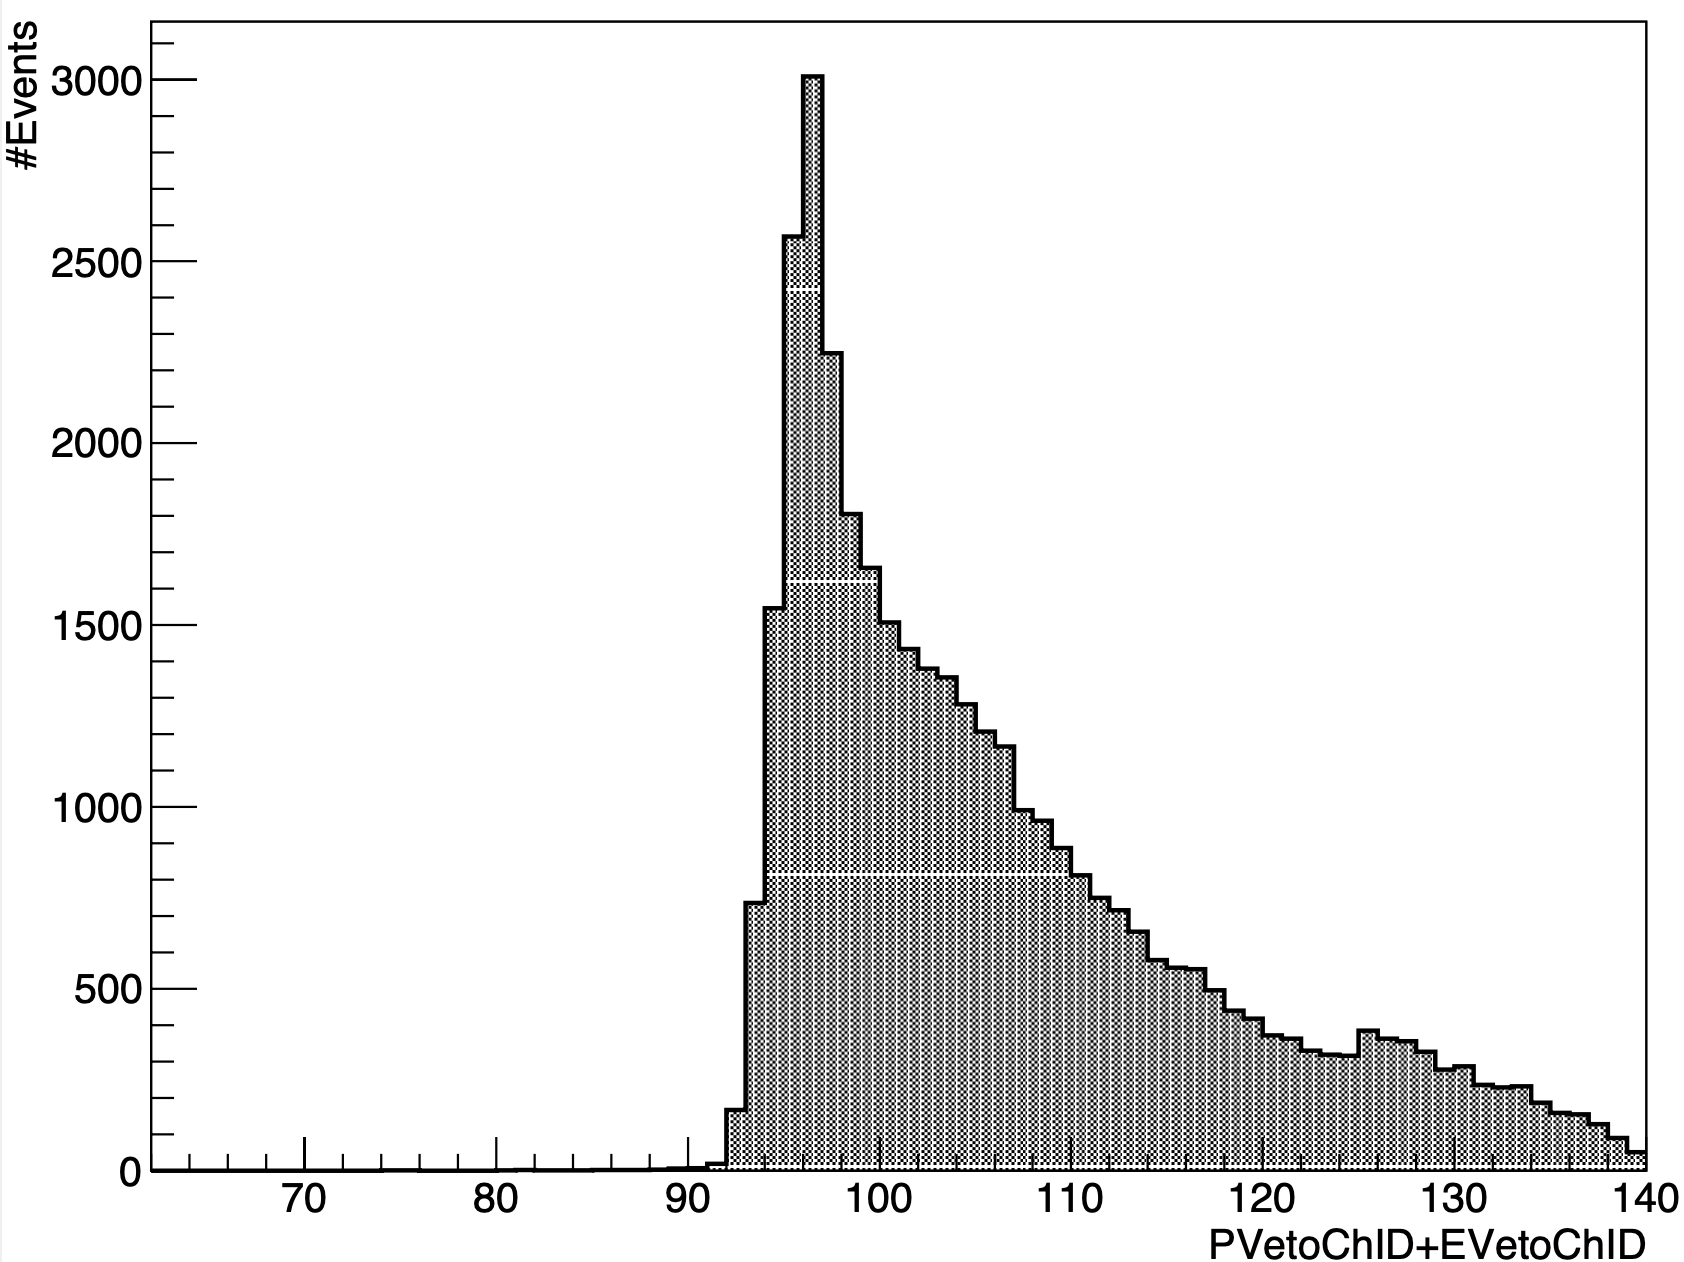
Whereas this is what the saved file looks like