Dear RooFit experts
I have a TTree *tree with (among other things) a lifetime of a particle from a toy experiment assuming ideal resolution and known lifetime. My code looks like the following snippet (in reduced form, units used are seconds):
[code]RooRealVar t(“t3d”, “t”, 0e-12, 15e-12, “seconds”);
RooDataSet data(“data”, “dataset”, RooArgSet(t), Import(*tree));
RooRealVar tau(“tau”,“tau”, 1e-12, 0e-12, 10e-12);
RooTruthModel idealres(“idealres”,“Ideal resolution model”,t);
RooAddPdf model(“model”, “model”, RooArgSet(decay), RooArgList(nsig));
model.fitTo(data);
RooPlot * frame_t = t.frame(Title(“Lifetime plot”));
data.plotOn(frame_t, Binning(nBins));
model.plotOn(frame_t,ProjWData(data));
[/code]
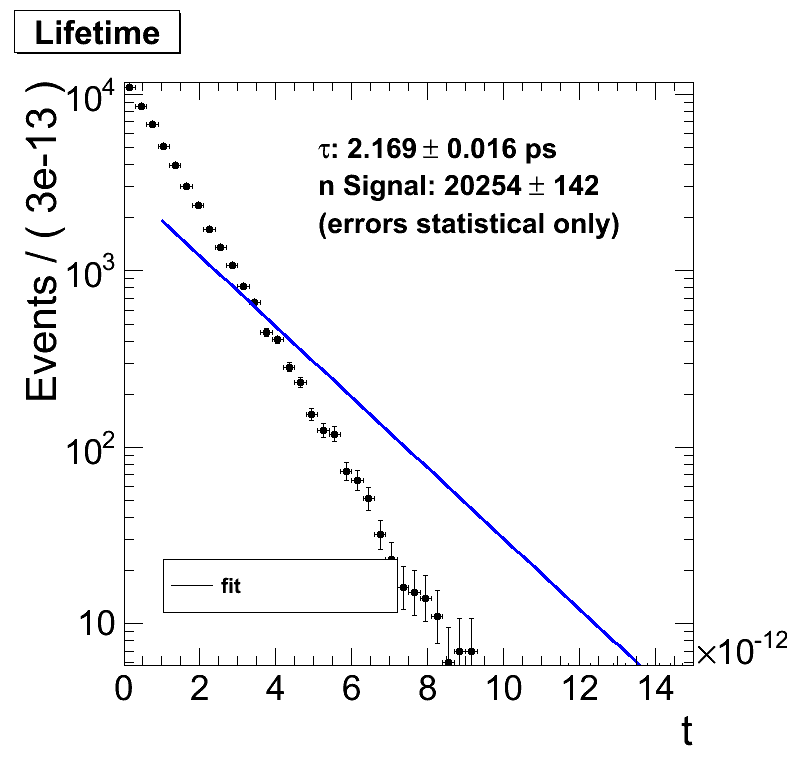
Running this code gives a nice result
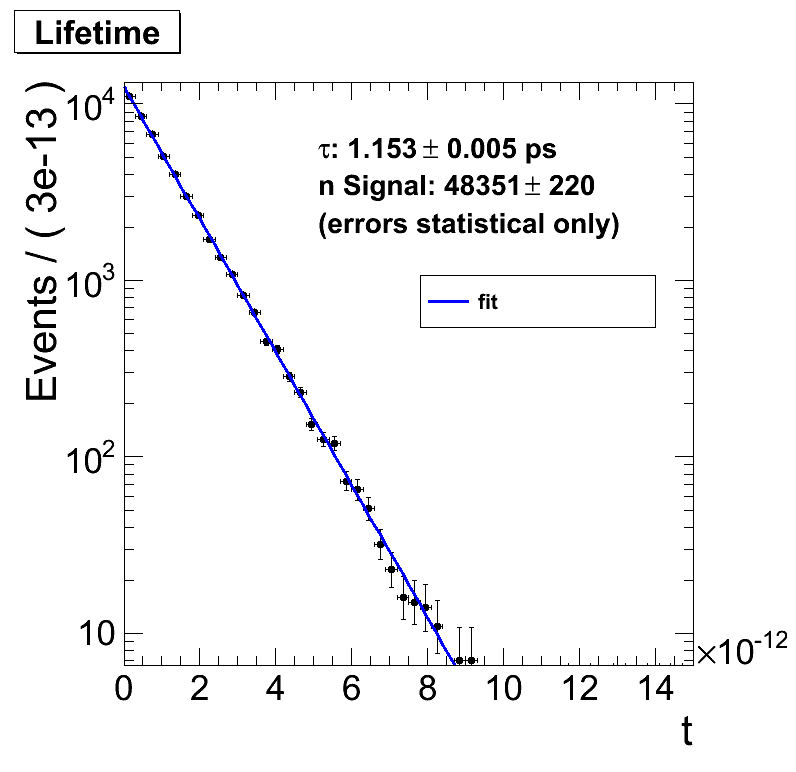
. But playing around with it I observe strange things:
- RooRealVar::setRange(…) has no effect on the fit
When I change the limits of my RooRealVar t (either in the constructor or calling setRange(…)) changes the x-axis of my plot but the fit is essentially the same up to the last comma. Example: RooRealVar t(“t3d”, “t”, 1e-12, 15e-12, “seconds”);
I would assume that also the fit range gets adjusted.
My question: Is this a bug or a feature?
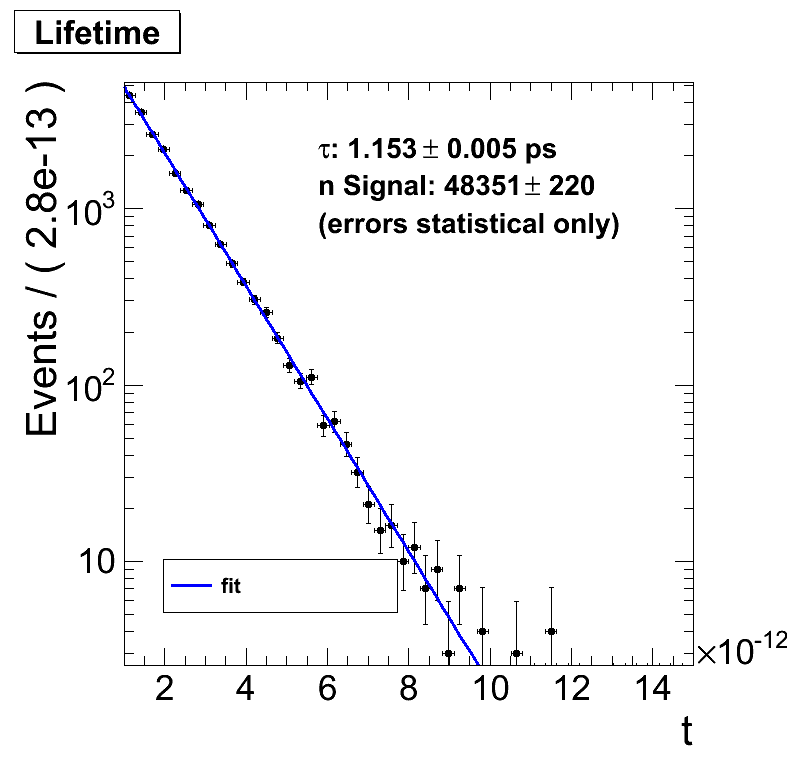
- Cutting away lifetimes smaller an arbitrary threshold gives fits making no sense
If I exclude entries with a lifetime of say 1e-12 s the fit makes no sense anymore. The output suggests that it worked (so no obvious error there) but does not fit the data on the plot.
Physicswise this should make no change as I can start the clock whenever I want, say 1 ps later. The distribution is still an exponential decay and the slope in a logarithmic plot should be the same.
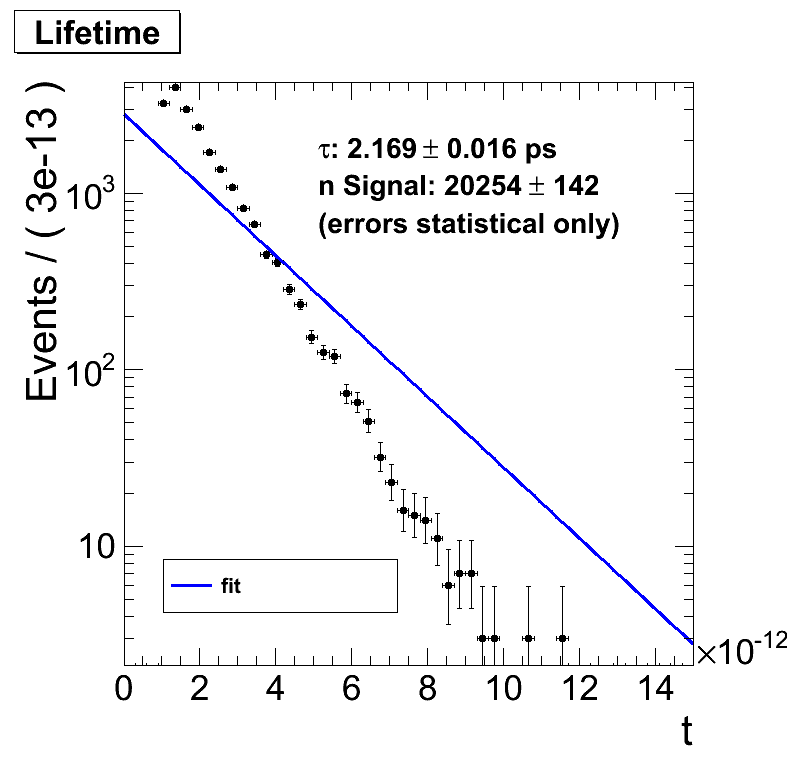
My question: How to deal with this? How can I fit to a dataset that does not start at 0 s?
I also tested (probably a naïve idea) to go for an extended likelihood fit using
RooRealVar nsig("nsig","signal fraction", 0., curEntries); // curEntries has number of entries in Tree
RooAddPdf model("model", "model", RooArgSet(decay), RooArgList(nsig));
but the behavior is the same.
Any suggestions are very welcome. I can provide more code or show some plots as needed.
Kind regards,
Frank