When I try to fit with using Roofit, I found that the result looks strange. I use a function
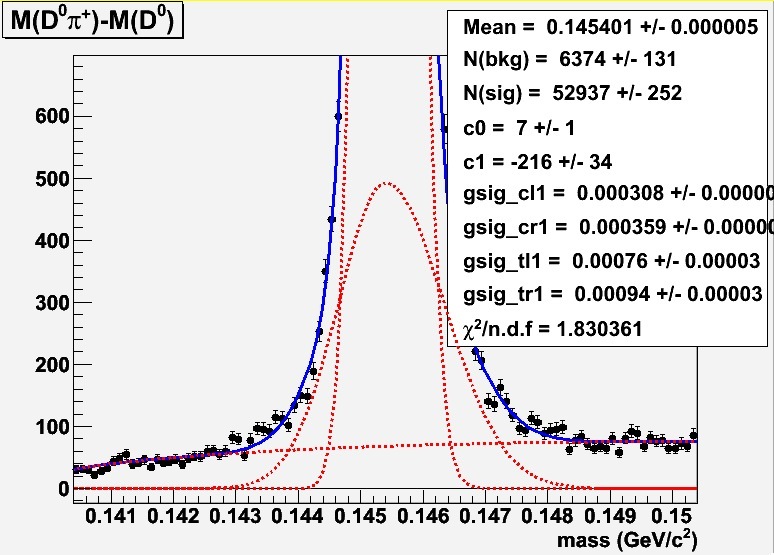
c0 * (x - 0.1395)^(1/2) + c1 * (x - 0.1395)^(3/2)
as my background p.d.f but fit parameter doesn’t make any sense. When I try to fit it without using Roofit, fit parameter looks reasonable. (I checked them by calculating the function at a point, 0.15, for example)
The plot of background p.d.f. looks fine. But I doubt the p.d.f is consistent with fit parameter.
RooFit works with probability density functions, not plain functions. Any pdf based on a formula expression (e.g. a RooGenericPdf, but also a custom pdf), is explicitly divided by its integral over x to construct the probability density function. Pdfs that have parameters that control the ‘vertical scale’, such as polynomials, but also your function, will have the meaning of those parameters changed by this normalization. (An additional issue that arises from this normalization is that you loose one degree of freedom: the overall vertical scale factor.)
In your case there are two options: 1) Construct your function as a roofit
function rather than a pdf and perform a chi^2 fit (fine at high statistics),