Hi,
I’m trying to fit a distribution using RooFit and the resulting fit looks strange. However, if I fit the same function using ROOT, I get a reasonably good fit.
This distribution comes from combining several samples with different normalisation weights and I was told that the default fit method, fitTo() can give poor results but I should try the chi2FitTo() method. (If this is true and is known, could someone explain why?)
If I use the values given by the ROOT fit, (“fixed”) then I get a seemingly good fit, but allow those parameters to float and the result is a very poor fit.
I’m also confused because if I generate an Asimov dataset from the created PDF, and then try to fit this I still see the strange effect. I would have thought that the PDF would fit the Asimov dataset perfectly (within statistical errors).
I’ve attached a script which should replicate my problem.
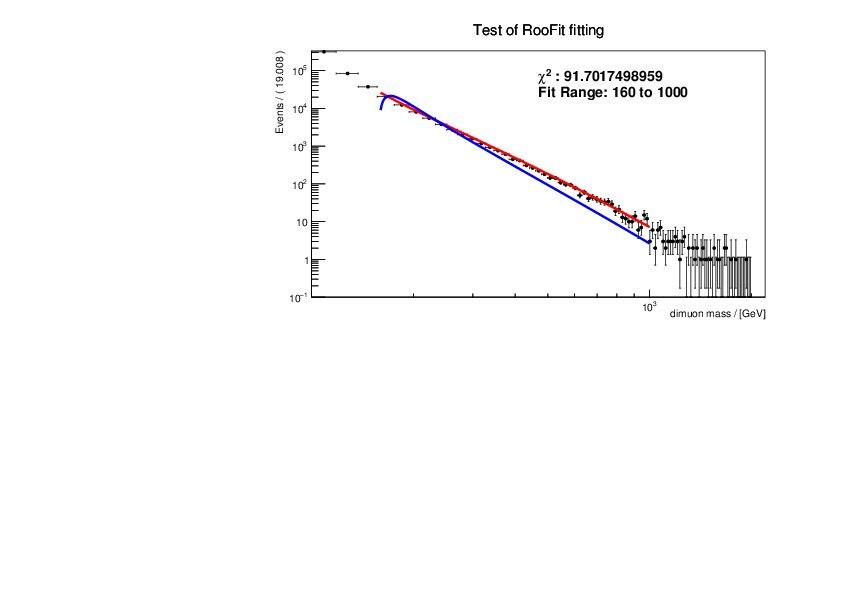
To explain the attached plot. I create a PDF and generate a dataset from this. These are the datapoints and red line which makes sense. The blue line is the result of the fit . I notice a similar but less severe problem when using the chi2FitTo() method.
Can someone tell me if I’m doing something wrong or inappropriate and how to fix it?
Thanks,
Chris
strangeFittingScript.py (3.3 KB)