I am doing a 2D extended maximum likelihood fit in RooFit (primarily binned but I am also summarizing the results from the unbinned version of it).
Data-Set = Signal (peak in both the variables ) and background (flat in both the variables)
(the reason of 2D fit is I have other backgrounds which are peaking, but for now, to isolate the problem I just mention flat background).
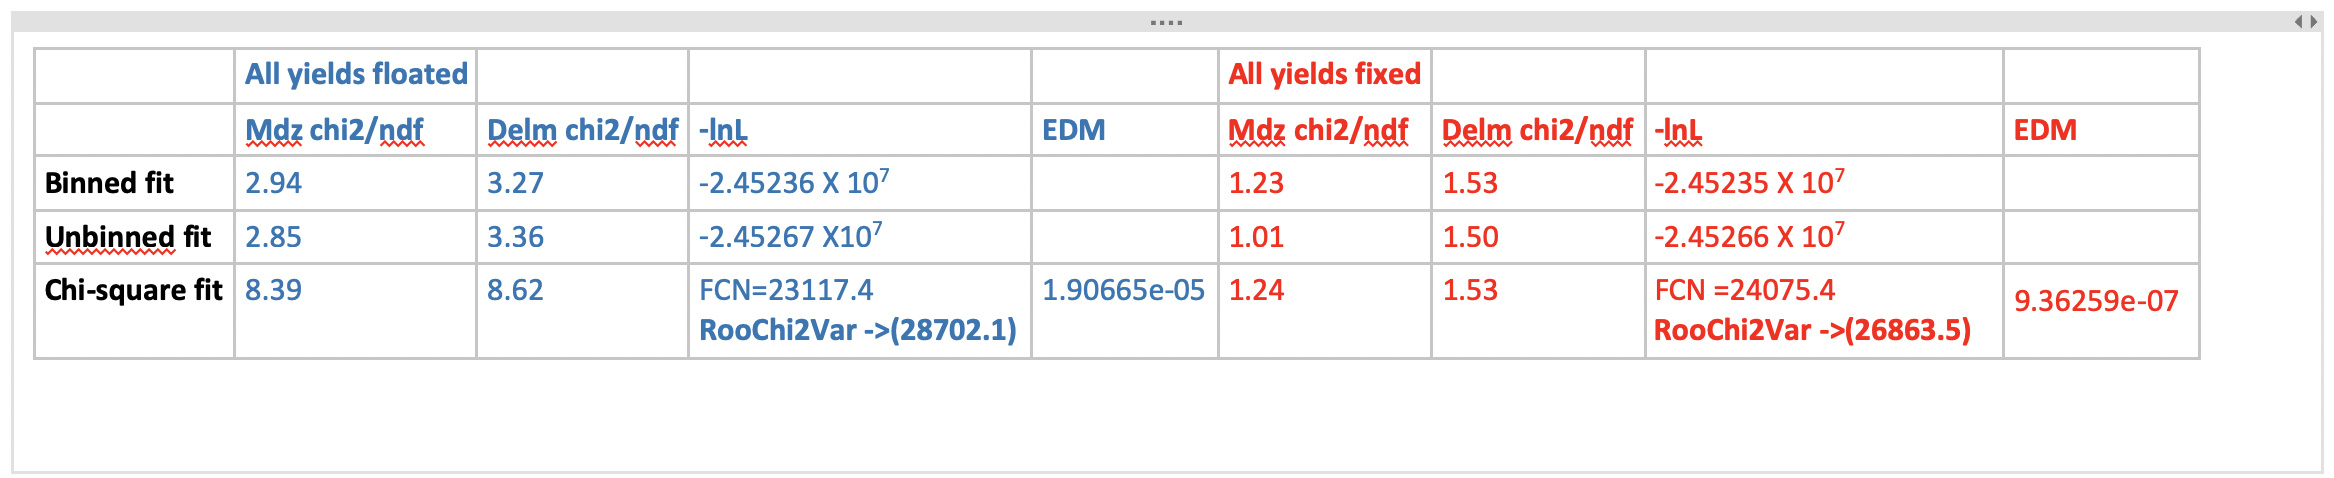
Below are the results from binned and unbinned extended maximum likelihood fits. All the pdf shape parameters are fixed except the mean, all the yields are floated. I see a consistent bias in the yield returned from fitter, a big fraction of Signal events are always assigned to background.
Binned fit
Unbinned fit
chi2/ndf (Md0)
deltam
-ln(L)
chi2/ndf (Md0)
deltam
-ln(L)
All yields fixed to expected value
1.23
1.53
-2.45235 X 10⁷
1.01
1.50
-2.45266 X 10⁷
yields floated
2.94
3.27
-2.45236 X 10⁷
2.85
3.36
-2.45267 X 10⁷
.
Between the first and second row the chi2/ndf changes by a large amount whereas the log likelihood value change doesn’t look very significant ?.
Does anyone know what might be the reason for this bias?
I think we are missing a crucial piece to get the full picture: What did you do to get the chi^2 values?
I remember that one (of probably multiple) ways to obtain chi^2 does the ndf correction, but ndf has a different meaning than what you might think. I would need to look up what the function you used is doing to get the details right.
If the problem is in the determination of ndf, it’s not surprising that you get different results when you change ndf by floating more fit parameters.
To obtain the Mdz chi2/ndf and Delm chi2/ndf , I have used the following code: mdz_frame->chiSquare() , deltam_frame->chiSquare()
where mdz_frame and deltam_frame are the frames used to draw 1d projections of my 2d fit pdf.
To obtain the values in 5th row, 4th and 8th column I am using: RooChi2Var chi2_val("chi2_val","chi2",mdzdel1,ds1) ; chi2_val.getVal() ; mdzdel1 is 2d fit pdf and ds1 is binned data-set on which chi-squared fit is performed.
Ok, so what you are seeing are chi^2 referring to different things.
Check the documentation for RooPlot::chiSquare. It compares a curve that has been plotted with the data distribution. Here’s the catch: It doesn’t have a way to know how many fit parameters were used to arrive at the curve.
That explains the difference you are seeing when you use more or less floating parameters. Without the correction, it will always assume that no parameters were floating.
You therefore must apply a correction. The number of floating parameters can be retrieved from the fit result, or you do it manually.
The RooChi2Var doesn’t do any NDF correction according to its documentation here. I guess you have to apply it.
Further note that in order to get properly normalised PDFs, you have to say what the observables are. Check if chi2_val.getVal() and chi2_val.getVal(RooArgSet(x, y)) are different (with the respective observables in your setup).
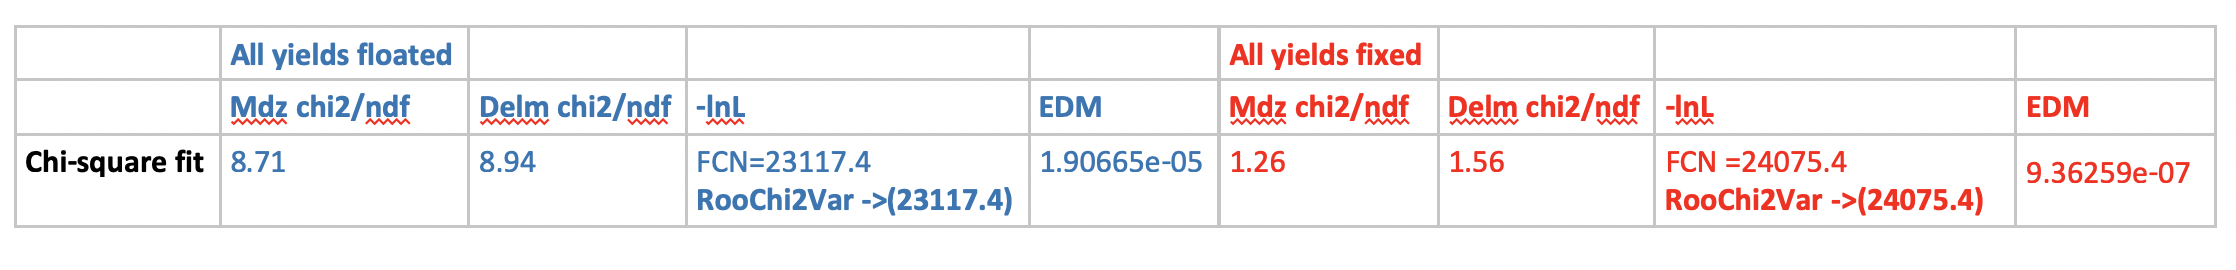
Changes Made:
1> To get # of floating parameters I have used:
``
RooArgSet observables(M_dz,deltam);
RooArgSet *flparams = mdzdel1.getParameters(observables);
int nparam = (flparams->selectByAttrib("Constant",kFALSE))->getSize();
mdz_frame->chiSquare(nparam);
deltam_frame->chiSquare(nparam);``
So the new chi-square/ndf values are little higher than previous ones since ndf get reduced by the # of floating parameters.
2> To get the raw chi-square value I am doing: RooChi2Var chi2_lowstat("chi2_lowstat","chi2",mdzdel1,ds1,Extended(kTRUE)) ; chi2_lowstat.getVal(observables);
so I added the option Extended(kTRUE) and this chi-square value matches with FCN now.
Also, adding observables in chi2_lowstat.getVal(observables); doesn’t make a difference.
3> Now, when the yield parameters are floated the fitter converges to a lower chi-square value than the one when the yields are fixed, since by definition the MINUIT is trying to find the least chi-square FCN.
All clear until here
But the chi-square values from 1d projections are much higher (8.71,8.94) in this case (yields floated) vs (1.26,1.56), do you know what might be the reason for the disagreement between 1d and 2d chi-square values ??
For the difference between 1D and 2D, I have two ideas:
NDF needs to be computed properly. Remember that in the 2D case, you have to compute NDF yourself because it’s only returning raw chi2 values. So you need the number of bins in 2D, and subtract the number of parameters.
Bin volume correction. The Chi2Var computes as follows: