Strange behavior in RooFit

Dear Expert,

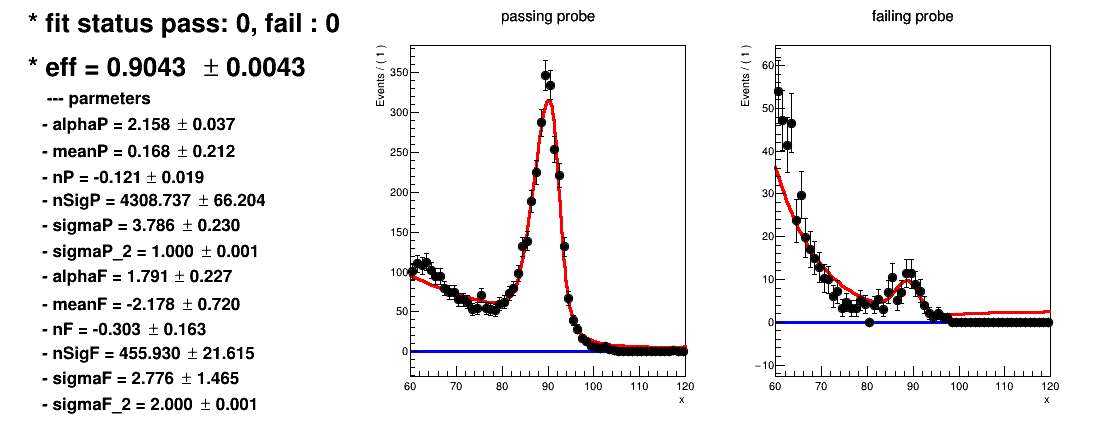
I try to fit some di-electron mass spectra using a modified crystal ball function [1] in RooFit. The fit results look ok in most of the case, but some times it gives me a strange tail at high mass (failing probe) [2].
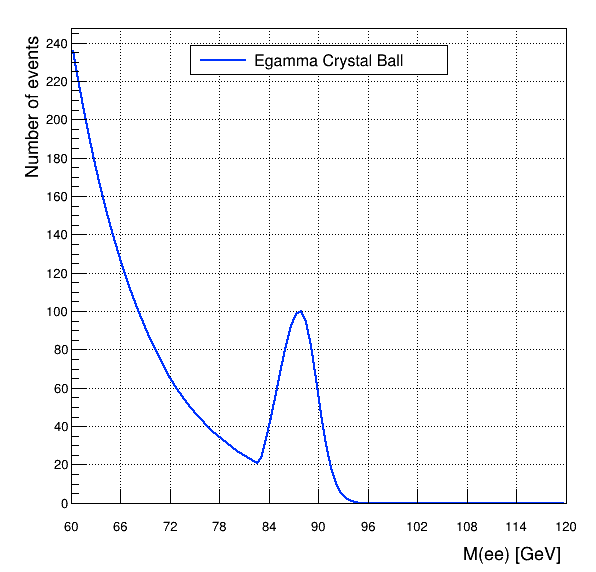
I passed the fitted parameter from the strange looking fit to a TF1 function[3], but I cannot see the tail [4].
Moreover, the graph of the function defined in RooFit looks smooth, while the one defined in TF1 is not.
My question is whether the tail I saw when fitting using RooFit is expected or is it a bug somewhere in my code.

Thank you very much,
Hoa.

[1] RooCBExGaussShape_Old.cc (2.0 KB)
[2]


[3] CodeTest_EGMCrystalBall.C (4.7 KB)
[4]

Hi,
I am not sure I have understood the problem.
The blue function in [4] must be the same as the red function in the right plot of [2] ?

Lorenzo

Hi,

Thank you for your reply.
Yes, those function are the same (only different by a scale factor). But it turns out the red function (for failing probe) has a strange tail on the right.
By the way, I uploaded the wrong (red) plot in my previous post. Please check again for the correct one.

Hoa,

OK, I see now the red function. Now it looks weird. I will investigate

Many thanks. Please let me know if you need more detail.

Hi,
If you can post the full RooFit running code making the wrong plot (missing also the header file of the class) I could help you find the problem you are having

Lorenzo

Hi Lorenzo,

Sorry for my late reply.
The running codes is not mine. So I will send you the ones that seems to produce the plot above.
Here are the codes:

  1. The missing header: https://github.com/jainshilpi/egm_tnp_analysis/blob/master/libCpp/RooCBExGaussShape.h
  2. The fit procedure (I’m pointing to the fitting & drawing steps)
    https://github.com/jainshilpi/egm_tnp_analysis/blob/d2bdd32e90f7b4cd1e46580231207059b3a10011/libCpp/histFitter.C#L130
  3. The config files that defines the function to fit.
    https://github.com/jainshilpi/egm_tnp_analysis/blob/master/libPython/fitUtils.py

Thank you very much.

Hoa.

Hi,
I am sorry but from what you post is difficult to reproduce this. It is better you send me a RooWorkspace and a macro reading from the workspace and producing that plot. Something small and simple that can be used to reproduce the results.

Lorenzo

Hi,

Thank you for your prompt reply. I will try to extract the RooWorkSpace.

Hoa.

This topic was automatically closed 14 days after the last reply. New replies are no longer allowed.