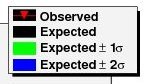
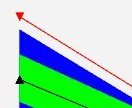
Hopefully this is the last question about this plot that I have. I have a TMultiGraph that shows the output of two graphs and the canvas is also showing a couple of TPolyline's for the +- sigma's. The problem that I have is that in the legend the two graphs show up with black backgrounds, but that is not how they are drawn. I will include the images of the legend and the a section of the plot region... How can I get rid of the black background when I did not even set it.
#include <iostream>
#include <string>
#include <TGraph.h>
#include <TMultiGraph.h>
#include <TStyle.h>
#include <TCanvas.h>
#include <TH1F.h>
#include <TLegend.h>

using namespace std;

int main(int argc, char *argv[]) {

  TGraph *exp_graph = new TGraph();
  exp_graph->Set(20);
  for(int i = 0; i < 20; i++) {
    exp_graph->SetPoint(i, i + 1, i + 1);
  }

  exp_graph->SetLineColor(1);
  exp_graph->SetMarkerColor(1);
  exp_graph->SetMarkerStyle(22);
  exp_graph->SetMarkerSize(1.5);

  TLegend *legend = new TLegend(0.7, 0.75, 0.95, 0.95);
  legend->AddEntry(exp_graph, "Expected");

  TCanvas *can = new TCanvas("mycanvas");

  can->SetFillStyle(4000);

  gStyle->SetPadColor(kWhite);
  gStyle->SetCanvasColor(kWhite);
  gStyle->SetFrameFillColor(kWhite);
  gStyle->SetHistFillColor(kWhite);
  gStyle->SetTitleBorderSize(0);
  gStyle->SetTitleStyle(0);

  exp_graph->Draw("ALP");
  legend->Draw();

  can->Print("simple.eps", "eps, Landscape, Preview");

}
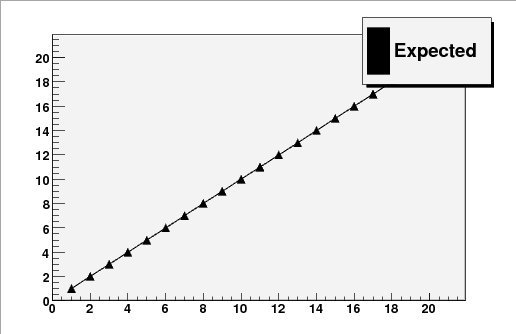
I have attached the plot that this generates and the root version is…
  *******************************************
  *                                         *
  *        W E L C O M E  to  R O O T       *
  *                                         *
  *   Version   5.20/00      24 June 2008   *
  *                                         *
  *  You are welcome to visit our Web site  *
  *          http://root.cern.ch            *
  *                                         *
  *******************************************

ROOT 5.20/00 (trunk@24524, Sep 07 2008, 16:49:00 on linux)

CINT/ROOT C/C++ Interpreter version 5.16.29, Jan 08, 2008
Type ? for help. Commands must be C++ statements.
Enclose multiple statements between { }.