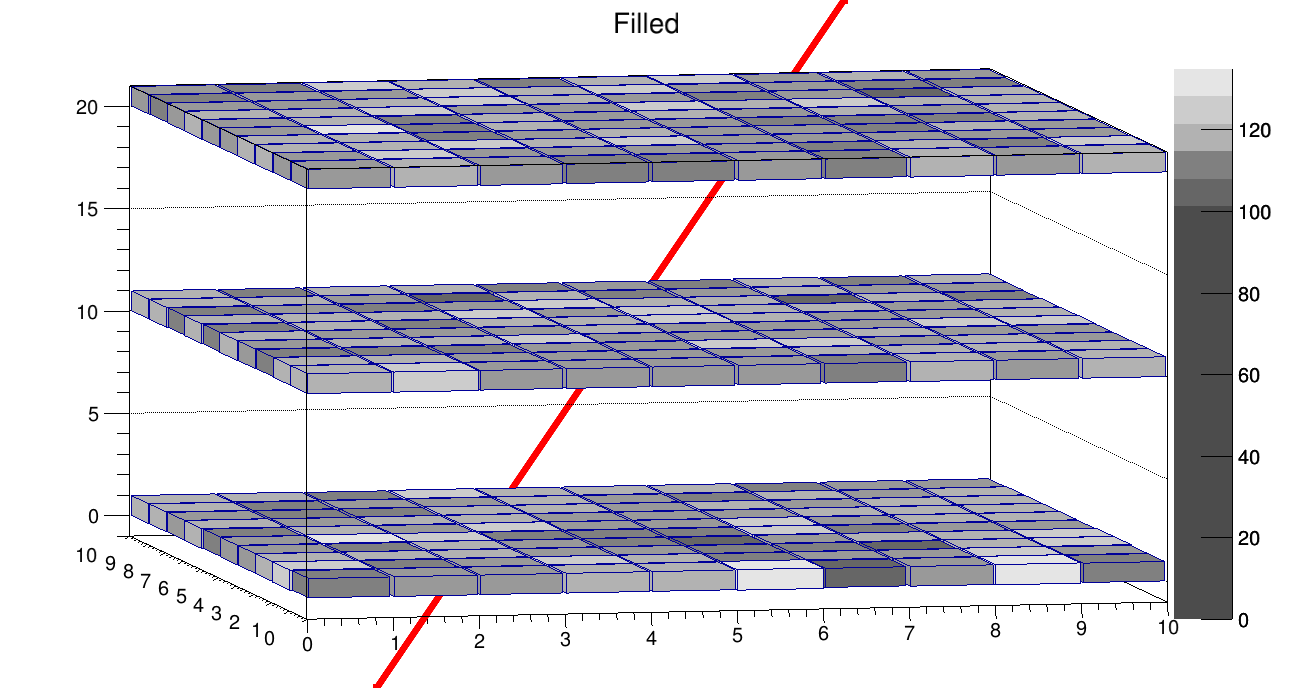
As seen (it’s better if you run it yourselves), the line is at the back of the entire histogram, and if I draw it after the TH3, it’s completely in the front. I can’t seem to get the desired effect of going through each “layer”.
I’d appreciate your help with this problem, thanks in advance to you all.
root [0]
Processing Many3DHistograms.cc...
In file included from input_line_11:1:
/Users/couet/Downloads/Many3DHistograms.cc:40:5: error: use of undeclared identifier 'ZOffset3D'
    ZOffset3D(h, 100);
    ^
/Users/couet/Downloads/Many3DHistograms.cc:62:5: error: use of undeclared identifier 'NewPalette'
    NewPalette(T, 100,19,12);  //greys, works great
    ^
/Users/couet/Downloads/Many3DHistograms.cc:73:1: error: C++ requires a type specifier for all declarations
Many3DHistograms(Nc,N);
^
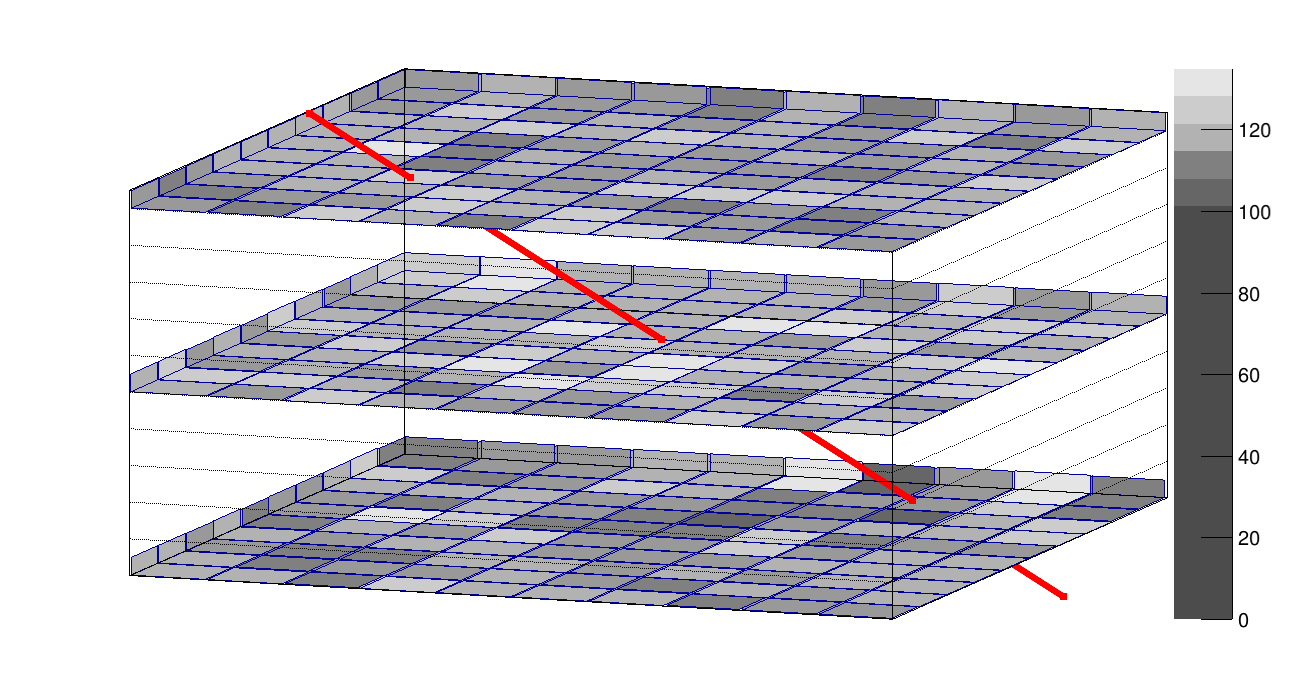
I found this topic interesting so I gave it a try:
if the line is drawn first, it will be behind any element of it.
if the TH3D is drawn first, the line always float in front of the histogram.
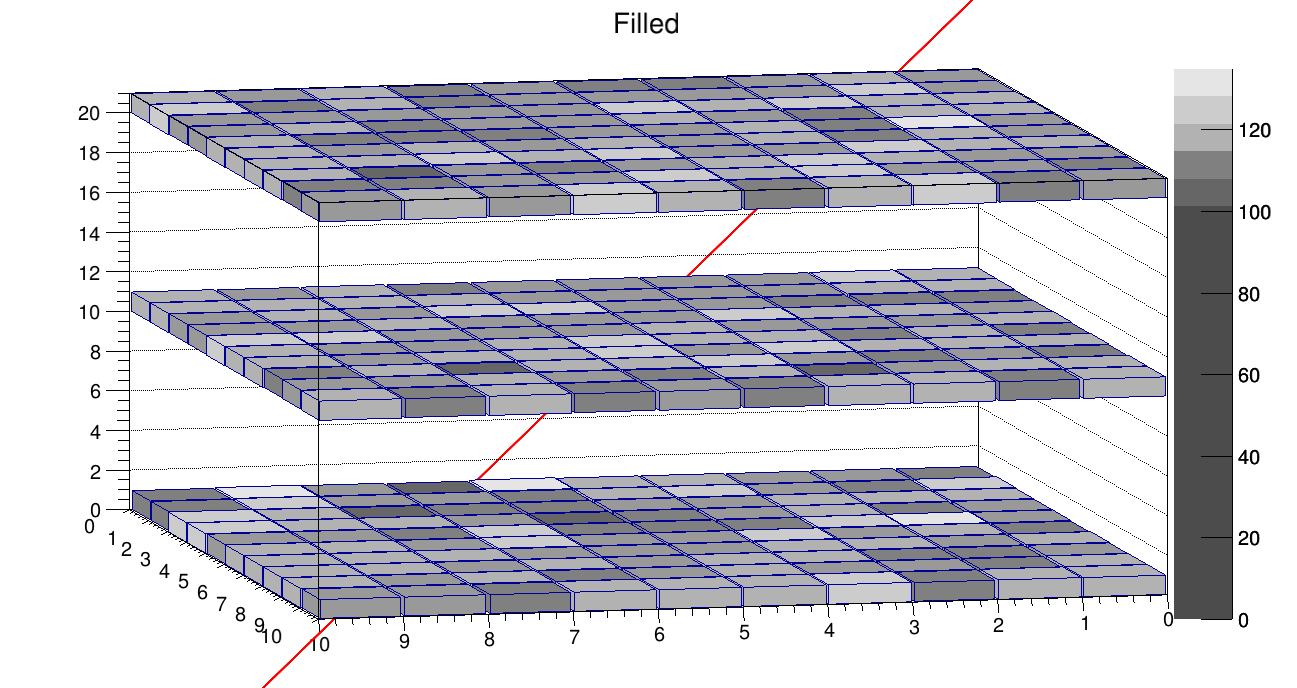
It seems like the visualization didn’t seem to handle the relation between objects?
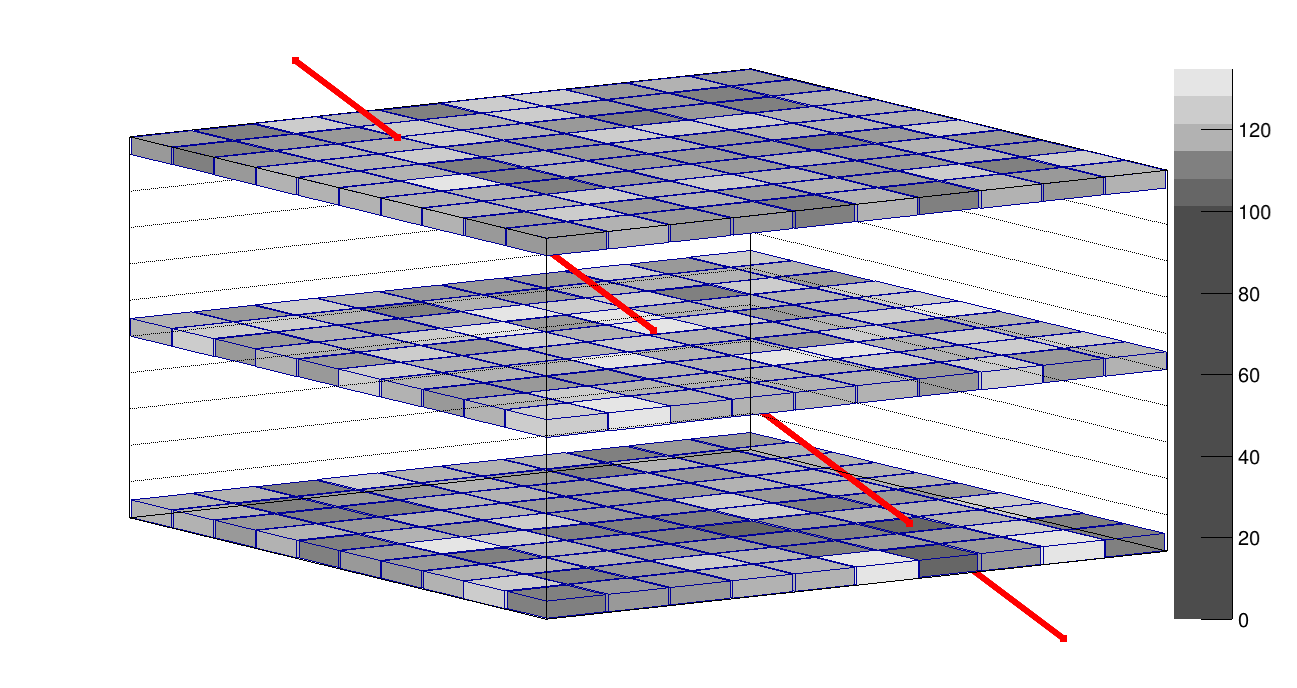
You can draw the line after like in the attached version of you macro but that does not really help as the line and the TH3s do not known each other and there fore there is not proper hidden line removal done.
Exactly, in my macro I drew it before the histogram, but as I said before
Isn’t there an object that can draw a curve that goes through another? Or a way to make it look like it? I looked everywhere and couldn’t find an answer.
I need the minimum of the histogram to be 0, but I don’t want to show values between 0 and 100 in the palette bar, I don’t know if there is a way of changing it without modifying the histogram.