Still having problems with GMT time on TAxis in TGraph

I’ve read a lot of the postings on getting a timescale on a histogram or TGraph axis, but I’m still having problems. Perhaps I don’t understand what is really going on…

If I manually create UNIX timestamps (seconds since the 1 January 1970 00:00:00 UTC epoch) and then plot them, they are still showing up in the local time (Eastern Daylight Time at the moment), EVEN if I set the time offset to use GMT

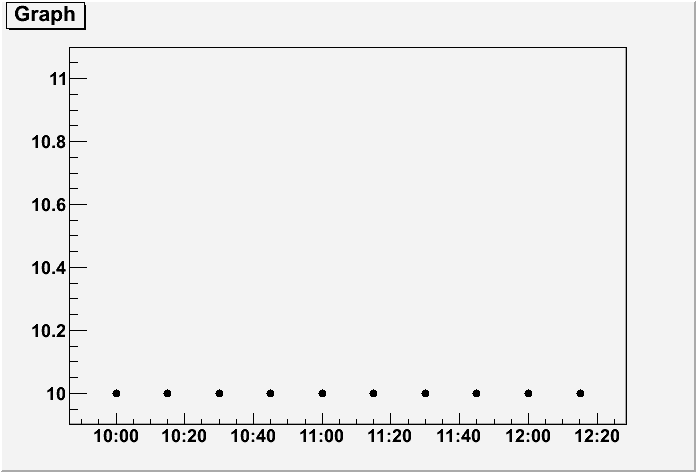
So the following code produces the attached plot

{
	Double_t X[10];
	Double_t Y[10];

	// creates TEN timestamps every 15 minutes from 
	// 15:00 1 January 1970 GMT to 17:15 1 January 1970 GMT

	for (Int_t i=0; i<10; i++) 
	{
		X[i] = 15.0*3600.0 + i*15.0*60; 
		Y[i] = 10.0;
	}

	// attempt to plot this data:
	
	TGraph *gr = new TGraph(10, X, Y);
	gr->SetMarkerStyle(kFullDotLarge);
	gr->GetXaxis()->SetTimeDisplay(1);
	gr->GetXaxis()->SetTimeOffset(0, "gmt");
	gr->GetXaxis()->SetTimeFormat("%H:%M");
	
	gr->Draw("ap");
}

What I THINK should happen is the time markers should start at 15:00 and then go up 17:15, but the plot still seems to be doing the conversion to EDT.

Since I have done everything I can think of to stay in GMT, why is the axis still doing this?

Note this is version 5.26/00b on Ubuntu 9.10, and my system clock is set to EDT.


I’ll check

With you macro on my linux box I get a different picture (see attachment).
Have you tried to use TDatime as suggested here:
root.cern.ch/drupal/content/how- … time-units
Instead of doing the conversion your self ?


This is really my point. I’m creating times in GMT, and I want to plot them on an axis in GMT. And, unless I’m really misreading things, I thought the point of the “gmt” in the line

gr->GetXaxis()->SetTimeOffset(0, "gmt"); 

was to give me an X-axis whose labels would be in GMT and not pay any attention to the local timezone.

Here is an other example.

{
   // Define the lowest histogram limit as 2010, January 10th 00:00
   TDatime T1(2010,01,10,00,00,00);
   Double_t X1 = T1.Convert();

   // Define the lowest histogram limit as 2010, January 10th 05:00
   TDatime T2(2010,01,10,05,00,00);
   Double_t X2 = T2.Convert();

   TH1F * h1 = new TH1F("h1","test",100,X1,X2);

   TRandom r;
   for (Int_t i=0;i<30000;i++) {
      Double_t noise = r.Gaus(0.5*(X1+X2),0.1*(X2-X1));
      h1->Fill(noise);
   }

   h1->GetXaxis()->SetTimeDisplay(1);
   h1->GetXaxis()->SetLabelSize(0.03);
   h1->GetXaxis()->SetTimeFormat("%H:%M");
   h1->GetXaxis()->SetTimeOffset(0, "gmt");
   h1->Draw();
}