I’m doing this from the terminal/ jupyter notebook. When I do something like:
TFile myfile(“rootfile.root”);
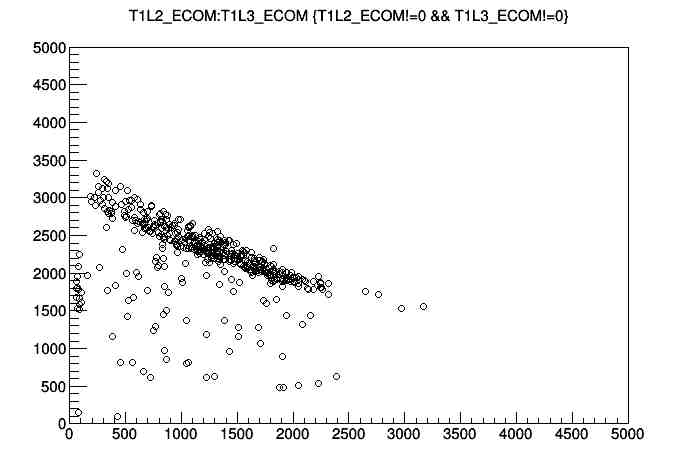
tree->Draw(branch1:branch2);
The resulting histogram has no stats box and no amount of fussing with
gStyle->SetOptStat();
will make one appear. However, when I do
TFile myfile(“rootfile.root”)
tree->Draw(branch1)
for a 1D histogram it appears by default. This is true of the tree browser/ tree viewer as well.
I know it’s possible because I got it to turn on once but never figured out how I did it 
I have no problem getting the stats box when I build the histogram in a macro with
hist->fill(branch1:branch2)
Thanks for your help