Hi,
I have a root file which is the output of an ntuple code maker and when i tried to plot any histogram the TPaveStats box is not created.
I tried:
gStyle->SetOptStat(“e”);
and many similar commands but i fail.
could you please help.
thanks,
Mai
Hi,
I have a root file which is the output of an ntuple code maker and when i tried to plot any histogram the TPaveStats box is not created.
I tried:
gStyle->SetOptStat(“e”);
and many similar commands but i fail.
could you please help.
thanks,
Mai
By default you should have the stat box. May be this particular histogram does not have stat box. In that case do:
h->SetStats(kTRUE);
where h is your histogram.
This is weird, it should be on by default (see TH1::SetStats(Bool_t stats = kTRUE)) Could you give more details about how you generate the histogram?
Try to play with the TStyle::SetOptStat(Option_t * stat) options
To me, this plot looks like “an unbinned 2-d scatter-plot (TGraph)”.
We would need a small code example to help you further.
Hi ,
I just draw this plot in the interactive root session , like
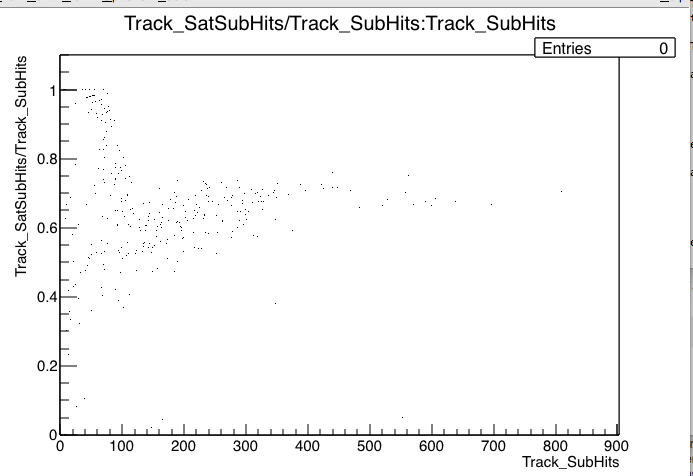
monopoles->Draw(“Track_SatSubHits/Track_SubHits:Track_SubHits”)
which monopoles is the TTree name in a root file which is the output of Ntuple producing process.
Maybe i will try to make a small macro to draw this plot and check if the box will appear or not.
thanks,
Mai
but for example one of the variable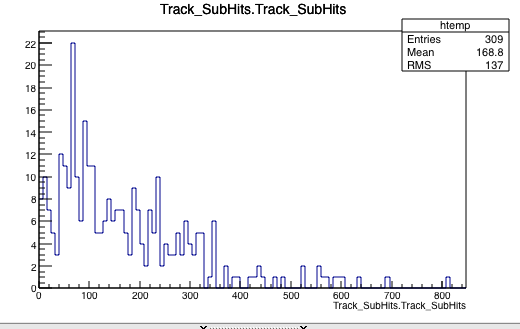 i am drawing in the TBrowser it has the box
monopoles->Draw(“Track_SatSubHits/Track_SubHits:Track_SubHits >> MyHisto”); // due to some bug, it does not display the statistics box …
MyHisto->Draw(); // … so you need to draw it manually
And now it works 
Many thanks
monopoles->Draw("Track_SatSubHits/Track_SubHits:Track_SubHits >> MyHisto");
Generates a scatter plot ((x,y) dots). To be sure you will plot the filled histogram specify an histogram plotting option.
monopoles->Draw("Track_SatSubHits/Track_SubHits:Track_SubHits >> MyHisto", "","COL");
or
monopoles->Draw("Track_SatSubHits/Track_SubHits:Track_SubHits >> MyHisto", "","SCAT");
The two steps @Wile_E_Coyote mentioned before would be better with option GOFF
monopoles->Draw("Track_SatSubHits/Track_SubHits:Track_SubHits >> MyHisto", "","goff");
MyHisto->Draw();
Note that if you execute the monopoles->Draw("… >> MyHisto") command two times or more (in a row), starting with the second pass, it will draw the statistics box (without any need for an additional “drawing option”).
Yes because at the 2nd execution the histogram already created. I works also without drawing option if you create the histogram before doing TTree::Draw.
root [0] TH2F *h2 = new TH2F("h2","h2",10,-10,10,10,-10,10)
root [1] ntuple->Draw("px:py>>h2")
tree->Draw(“Branch1:Branch2>> MyHisto”, “”,“SCAT”)
MyHisto->Draw()
worked for me, but how do I pipe the bin info in that case? I would usually do:
tree->Draw(“Branch1:Branch2>>(ybinx,ymin,ymax, xbins,xmin,xmax)”)
tree->Draw(“Branch1:Branch2 >> MyHIsto(ybinx,ymin,ymax, xbins,xmin,xmax)”)
Thanks! I tried
tree->Draw(“Branch1:Branch2 >> (ybinx,ymin,ymax, xbins,xmin,xmax)MyHisto”)
and it didn’t work so I gave up. Silly me.