Hi experts,
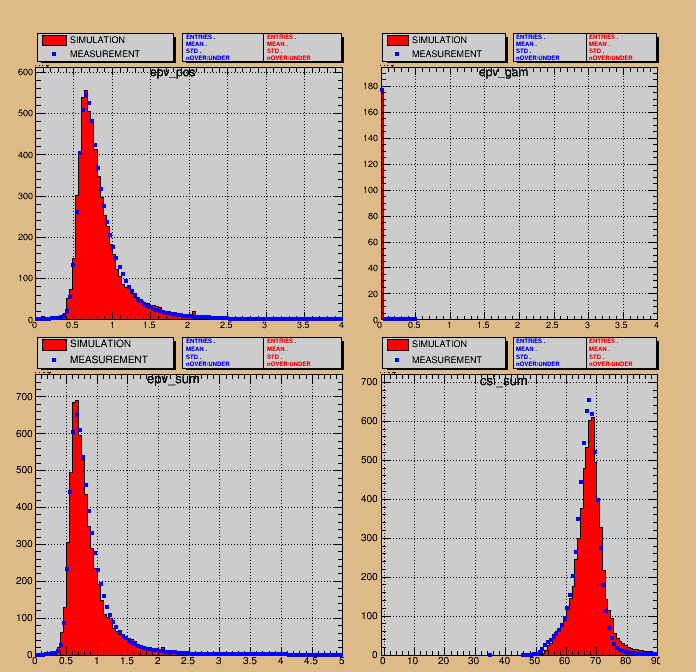
I would like to draw histograms with the statistics and legend boxes separate entirely from the plot. I produce lots of histograms and it becomes tedious to position the boxes individually, so a box underneath or above the actual plot would be ideal. Is there a simple way of doing this? I have an (unreadable and complicated) macro that does this. But would like a simple option if one exists. Attached is an example of the plot format I yearn for.
Many Thanks!
Mike
EDIT
It seems the pdf was corrupt. I attach a png
example.pdf (8.1 KB)