StandardHypoTestDemo and asimovData

Hello RooExperts,

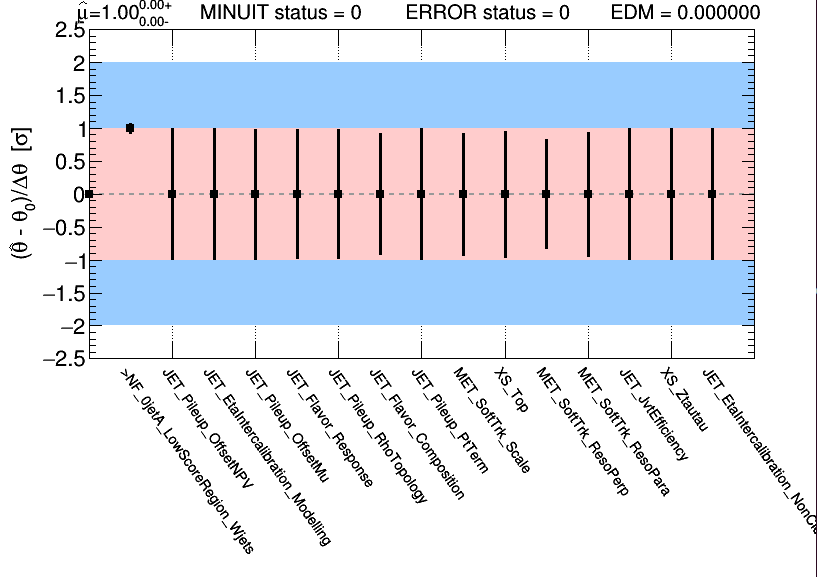
I’m struggling to estimate the expected median significance for a model [1] containing few nuisance parameters (that survive after some pruning procedure). The model is already Asimov and the pulls look reasonable [2]. The fit converges and the amount of signal looks sizable compared to background in many bins [3]. To estimate the significance I use the StandardHypoTestDemo.C code with the asymptotic calculator and the one-sided LHC test statistic. I use Minuit2 and the robust strategy 2 for the minimizer.

When setting

dataName = "asimovData"
noSystematics = 1

I obtain somehow desirable results [4]. When I switch to “obsData”, then I get a totally different response [5]. But more significantly, when I do set noSystematics = 0 I obtain NAN results [6]. In the latter case it seems that the fit is not converging (see log with verbosity level set at 3 [7]) in contrast to the converged fit I obtained with another program based on RooFit but with the same settings (strategy = 2, Minuit2).

My questions are:

  • It makes sense to use asimovData and poiValue > 0 for the expected significance calculation. Am I right?

  • I don’t understand why the StandardHypoTestDemo fails with noSystematics = 0. Is it safe anyway to set it always to noSystematics = 1 when computing the expected significance?

  • my model is already Asimov, i.e. data = bkg + signal. Shouldn’t StandardHypoTestDemo give me the same results if I set dataName to “asimovData” or “obsData”?

Thank you in advance for your help!

Best regards,

Zinonas

[1] RooWorkspace built with HistFactory: ~zenon/public/RooWorkspace.root on lxplus

[2] Pulls plot attached:

[3] Postfit distribution plot attached:

(the binning in the workspace is equidistant)

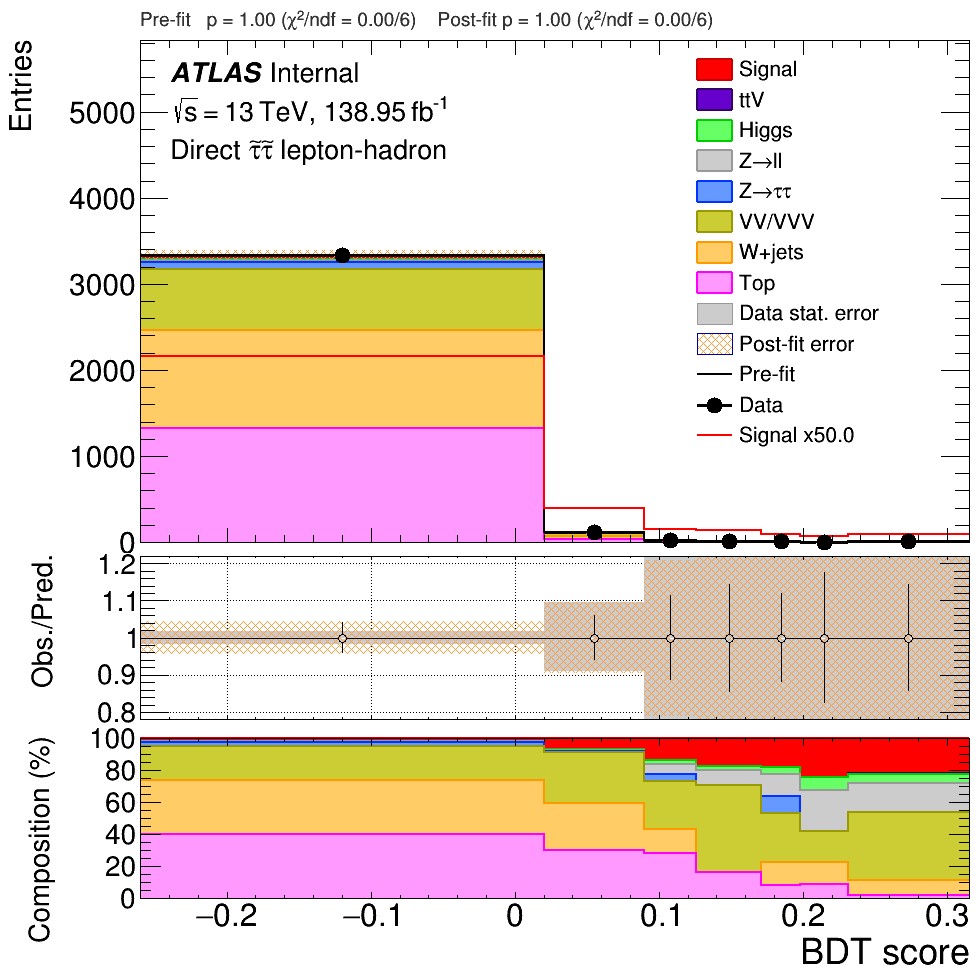
[4] Results HypoTestAsymptotic_result:

  • Null p-value = 0.0330297
  • Significance = 1.83802
  • CL_b: 0.0330297
  • CL_s+b: 0.5
  • CL_s: 15.1379
    Asymptotic results
    Expected p -value and significance at -2 sigma = 0.564339 significance -0.161979 sigma
    Expected p -value and significance at -1 sigma = 0.20101 significance 0.838021 sigma
    Expected p -value and significance at 0 sigma = 0.0330297 significance 1.83802 sigma
    Expected p -value and significance at 1 sigma = 0.00226971 significance 2.83802 sigma
    Expected p -value and significance at 2 sigma = 6.2015e-05 significance 3.83802 sigma

[5] Results HypoTestAsymptotic_result:

  • Null p-value = 0.5
  • Significance = -0
  • CL_b: 0.5
  • CL_s+b: 0.96697
  • CL_s: 1.93394
    Asymptotic results
    Expected p -value and significance at -2 sigma = 0.564339 significance -0.161979 sigma
    Expected p -value and significance at -1 sigma = 0.20101 significance 0.838021 sigma
    Expected p -value and significance at 0 sigma = 0.0330297 significance 1.83802 sigma
    Expected p -value and significance at 1 sigma = 0.00226971 significance 2.83802 sigma
    Expected p -value and significance at 2 sigma = 6.2015e-05 significance 3.83802 sigma

[6] Results :

  • Null p-value = nan
  • Significance = -nan
  • CL_b: nan
  • CL_s+b: nan
  • CL_s: nan
    Asymptotic results
    Expected p -value and significance at -2 sigma = -nan significance nan sigma
    Expected p -value and significance at -1 sigma = -nan significance nan sigma
    Expected p -value and significance at 0 sigma = -nan significance nan sigma
    Expected p -value and significance at 1 sigma = -nan significance nan sigma
    Expected p -value and significance at 2 sigma = -nan significance nan sigma

[7] ~zenon/public/hypo.log on lxplus

Hi @Zinonas_Zinonos,

Some ideas:

  • It’s not a surprise that the fit works with asimov data. That’s why we have them.
  • If it doesn’t work with data, there is something in your model that prevents it from describing the data.
    • Maybe a systematic uncertainty is missing. (This also applies to the ‘nosystematics’ case. If it is impossible to describe the data with what the model provides, you have a problem. Lets say, for example, that your model predicts a bin content of 10 in 2 neighbouring bins. The data has 20 events in one bin, but 0 events in the other. What should the scale factor for your model be? If you have a Poisson uncertainty for the Monte Carlo statistics, the solution is to pull the nuisance parameter such that the model predicts zero in the bin that doesn’t have data. See below why this might be important.)
    • Two systematic uncertainties are degenerate (same effect on the likelihood), and therefore 100% correlated or anti-correlated. (obviously that doesn’t apply to the case where you don’t have systematics)
    • Your model predicts bin contents with zero or negative entries. Think of something like -0.1 * signal + 1 * background, where the background is zero in one bin. This doesn’t work in a likelihood.
  • In fact, the error message from the log hints at something like this:
RooPoisson::gamma_stat_stau_channel_lephad_SR_0jetA_high_score_bin_4_constraint[ x=nom_gamma_stat_stau_channel_lephad_SR_0jetA_high_score_bin_4 mean=gamma_stat_stau_channel_lephad_SR_0jetA_high_score_bin_4_poisMean ]
     getLogVal() top-level p.d.f evaluates to zero @ x=nom_gamma_stat_stau_channel_lephad_SR_0jetA_high_score_bin_4=2.22623, mean=gamma_stat_stau_channel_lephad_SR_0jetA_high_score_bin_4_poisMean=0
  • Apparently, it is favourable to pull the mean gamma_stat_stau_channel_lephad_SR_0jetA_high_score_bin_4_poisMean to zero, maybe because there are no data in the bin.
    • What’s the logarithm of a zero Poisson likelihood? (–> -infinity)
    • What happens if you use that in a calculation? (–> Maybe more infinities, maybe NaN)
      It could be that this is happening because of what I described above.
  • If a zero bin is really the problem, you could merge it with another bin such that the number of events in the bin is non zero. Or you could limit certain parameters such that they cannot go negative or to zero.

The rest is probably up to you. Have a look at the histograms for

  • data
  • signal
  • background
    and make sure that they are reasonable.

To answer your questions:

  1. You can have POI = 0 or 1, or any other value in the asimov data. If the model is well-defined, all of them should work.
  2. noSystematics=0 means that systematics are on. In particular, the nuisance parameter that I pointed out above is on. It’s broken, though, as you can see above.
  3. Asimov doesn’t mean bkg + signal. It means that data have been generated from the distribution that your model represents. If you set mu=0 in your model, it’s background asimov, if you set it to 1, it’s signal+background asimov. Think of “asimov = simulation”.
    If you fit data that have been generated from simulations, you get exactly what you would expect, the expected significance. If you set the data to real data, you observe something in the data. But if your model is not able to describe the data, the fit will fail or yield wrong results.

OK, thank you for the hints @StephanH

This topic was automatically closed 14 days after the last reply. New replies are no longer allowed.