Let me know stand-alone usage of JSROOT for TGraph and TMultiGraph.
I want to use JSROOT on raspberry-pi which is the computer for our SCA counter daq.
I wrote daq program with embedded web server. It doesn’t use ROOT THttpServer because ROOT can’t be installed on ARM7 as I know. I confirmed jsroot works well in my daq program by modifying stand-alone 2d-histogram example to request json data and draw the received data from daq server.
I want to draw dynamic count rates .vs. time using TGraph and TMultiGraph.
Some example like 2d-historgam example helps me
I’m a bit confused here… How could you produce TGraph and TMultiGraph without ROOT? JSROOT is made to either read ROOT files on the web, or read ROOT objects (in json format) via http server (in both cases they are produced by ROOT).
Please see the javascript source code of https://root.cern.ch/js/latest/demo/example.htm.
It reproduces TH2 without ROOT objects by using setBinContent(bin, val) method. I modified the code to take the array of ‘val’ values from http sever using NewHttpRequest method. You can see it in the code below.
I would like to believe TGraph has some filling function like setBinContent of TH2.
I found some solution for TGraph.
I modified JSROOT.CreateTGraph in JSRootCore.js to have additional parameters of arrays of x, y points.
These are javascript code in example html file and the output
<script type='text/javascript'>
var cnt = 0;
function updateGUI() {
// this is just generation of graph
var npoints = 20;
var xpts=[];
var ypts=[];
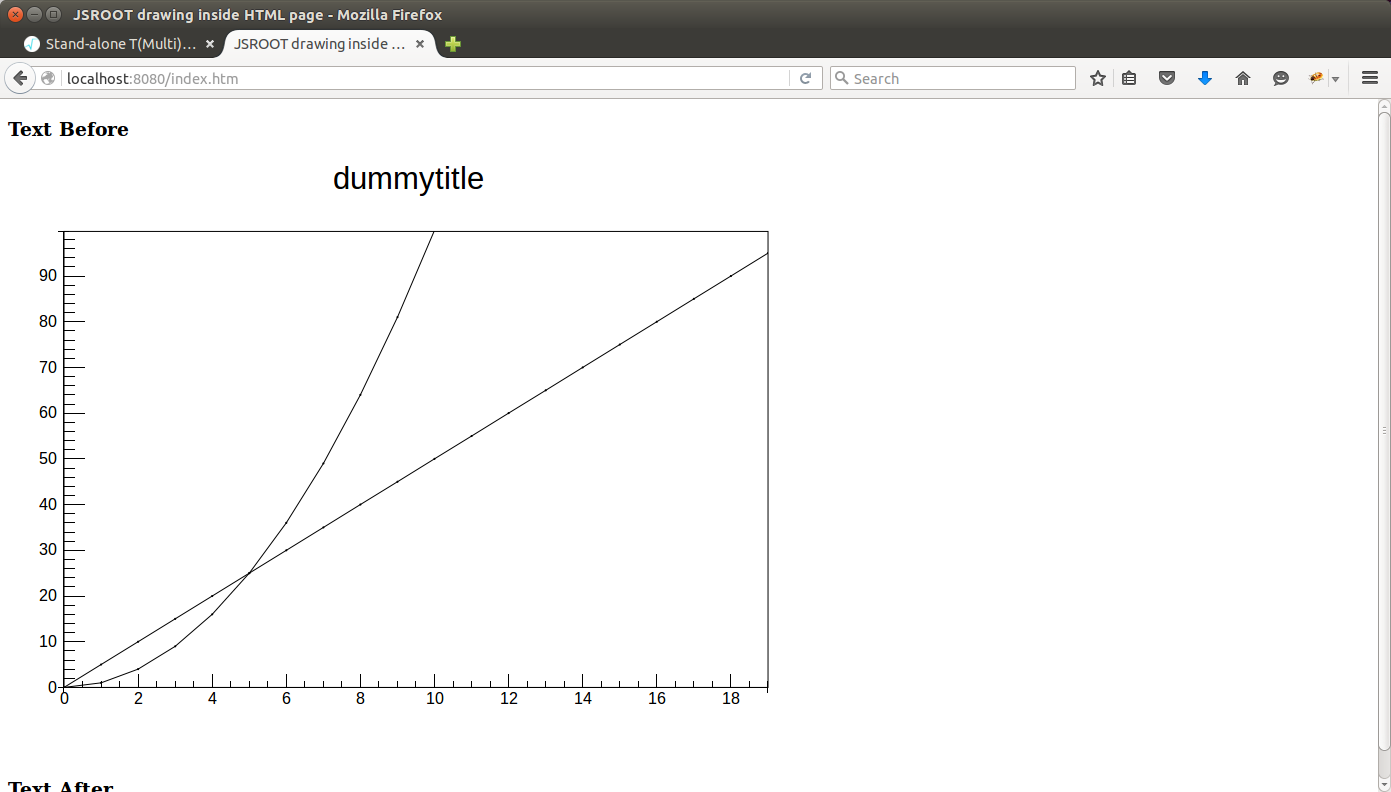
for (var i=0; i<npoints; i++) {
switch (cnt % 2) {
case 1: xpts.push(i); ypts.push(i*i); break;
default: xpts.push(i); ypts.push(i); break;
}
}
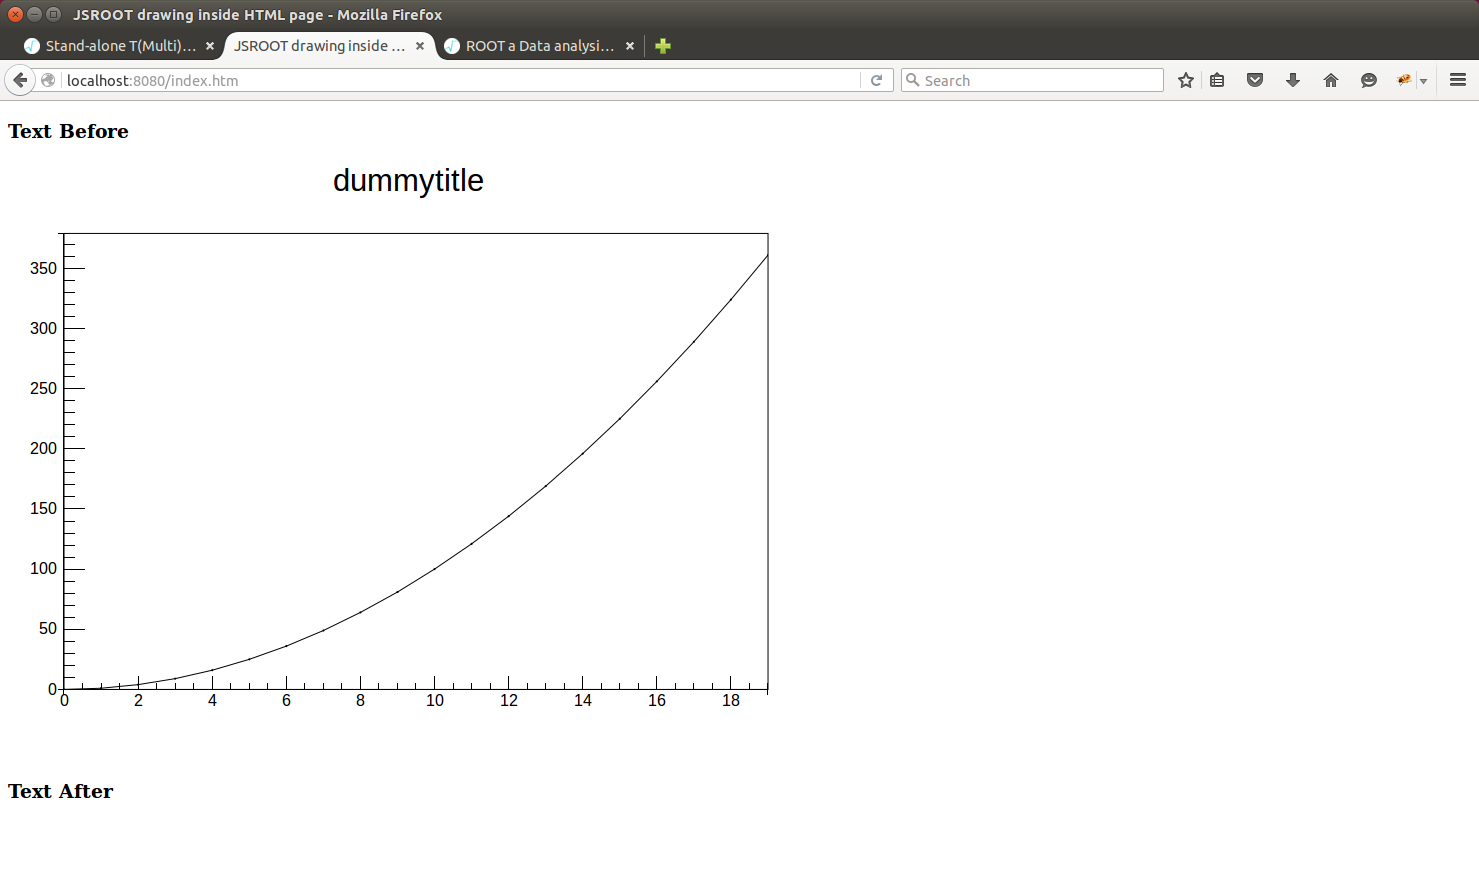
var graph = JSROOT.CreateTGraph(npoints, xpts, ypts);
JSROOT.redraw('object_draw', graph);
if (cnt++ == 0) setInterval(updateGUI, 3000);
}
</script>
Now I’m trying to find solution for TMultiGraph JSRootCore.js.diff (2.44 KB)
I will adopt your code with some modifications.
Later I will provide example with standalone usage of TMultiGraph.
Seems to be, I need to adjust JSROOT code anyway that TMultiGraph update works correctly.