Dear Experts
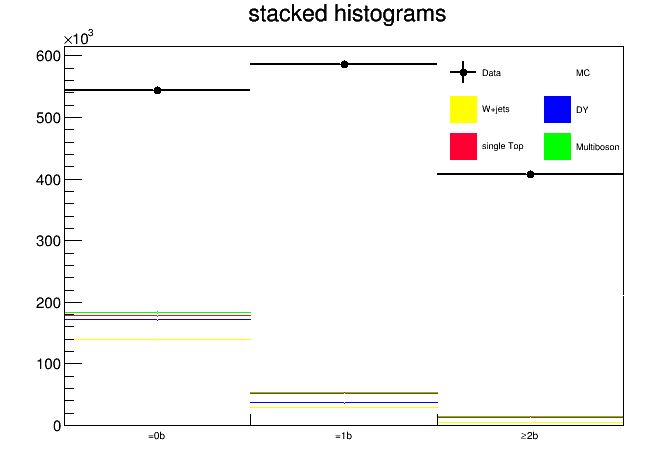
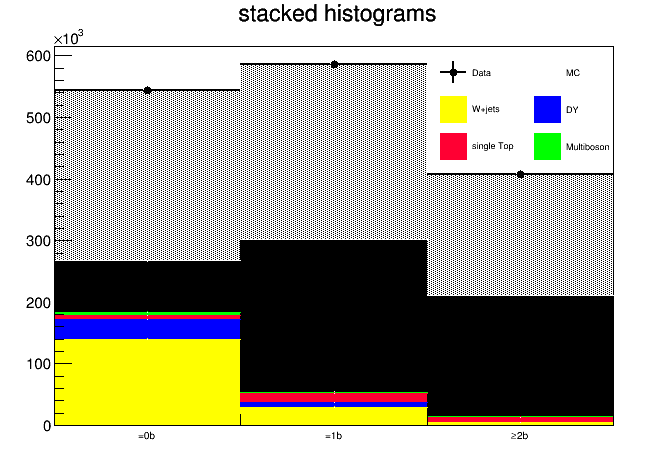
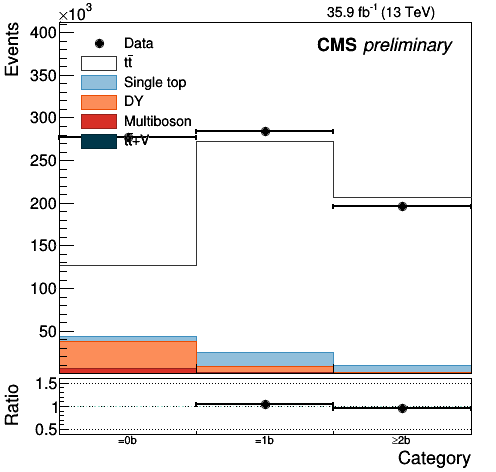
I have a problem regarding stacking of histograms. I want to stack histograms for signals and backgrounds. I am getting my variables (Histograms) from muminus_plotter.root. When i try to draw it give me the following result{1}. Idont know why this black colour appears here. Actually i want to obtained result like this{2}. The code as well as the result is given below. Kindly if you can help me to figure it out.
2.
{
TString path = "/root/from_Qamar/";
//TFile *file1 = new TFile(path+"muplus_plotter.root");
TFile *file1 = new TFile(path+"muminus_plotter.root");
//TFile *file1 = new TFile(path+"MC13TeV_SingleT_t.root");
//TFile *file1 = new TFile(path+"MC13TeV_SingleT_tW.root");
//TFile *file1 = new TFile(path+"MC13TeV_SingleTbar_t.root");
//TFile *file1 = new TFile(path+"MC13TeV_SingleTbar_tW.root");
THStack hs("hs"," stacked histograms");

TH1* h_0 = (TH1*)file1->Get("nbtags_4j/nbtags_4j_W");
TH1* h_1 = (TH1*)file1->Get("nbtags_4j/nbtags_4j_DY");
TH1* h_3 = (TH1*)file1->Get("nbtags_4j/nbtags_4j_Single top");
TH1* h_4 = (TH1*)file1->Get("nbtags_4j/nbtags_4j_Multiboson");
TH1* h_5 = (TH1*)file1->Get("nbtags_4j/nbtags_4j_t#bar{t}+V");

//data
TH1* h_6 = (TH1*)file1->Get("nbtags_4j/nbtags_4j");
h_6->SetLineColor(kBlack);
//h_6->SetFillColor(kBlack);
h_6->SetFillStyle(3002);
//h_6->FillRandom("gaus",200000);
h_6->SetMinimum(0);
h_6->SetMaximum(100000);
//int p = 782411;
//for(int i = 0; i < p; i++){ // Event Loop starts
//h_6->Fill(i);
//}
h_6->Draw();

//MC
TH1* h_2 = (TH1*)file1->Get("nbtags_4j/nbtags_4j_t#bar{t}");
h_2->SetLineColor(kWhite);
h_2->SetMinimum(0);
h_2->SetMaximum(1000000);
int n = 2801172;
for(int i = 0; i < n; i++){ // Event Loop starts
h_2->Fill(i);
}
h_2->Draw("sames");

h_0->SetLineColor(kYellow);
h_0->SetFillColor(kYellow);
h_0->SetMinimum(0);
h_0->SetMaximum(10000);
int f = 140000;
for(int i = 0; i < f; i++){ // Event Loop starts
h_6->Fill(i);
}

h_0->Draw("sames");
//hs->Add(h_0);

h_1->SetLineColor(kBlue);
h_1->SetFillColor(kBlue);
h_1->SetMinimum(0);

int a = 25000;
for(int i = 0; i < a; i++){ // Event Loop starts
h_1->Fill(i);
}
h_1->Draw("sames");
//hs->Add(h_1);

h_3->SetLineColor(kPink);
h_3->SetFillColor(kPink);
h_3->SetMinimum(0);
h_3->SetMaximum(10000);

//h_3->GetXaxis()->SetRange(0,100);

int r = 167273;
for(int i = 0; i < r; i++){ // Event Loop starts
h_3->Fill(i);
}


h_3->Draw("sames");
//hs->Add(h_3);

h_4->SetLineColor(kGreen);
h_4->SetFillColor(kGreen);
h_4->SetMinimum(0);
int s = 90000;
for(int i = 0; i < s; i++){ // Event Loop starts
h_4->Fill(i);
}
h_4->Draw("sames");
hs->Add(h_0);
  hs->Add(h_1);
  hs->Add(h_3);
  hs->Add(h_4);
  hs->Add(h_5);
  hs->Add(h_2);
  hs->Add(h_6);
  hs->Draw("BAR");

TLegend *leg = new TLegend( 0.6449843,0.65038,0.8377743,0.8838219,NULL,"brNDC");
 leg->SetFillColor(0);
 leg->SetBorderSize(0);
 leg->SetTextFont(42);
 leg->SetTextSize(0.02);

 leg->SetLineColor(2);
 leg->SetLineStyle(2);
 leg->SetLineWidth(1);
 leg->SetMargin(0.55);
 leg->SetNColumns(2);
 leg->SetColumnSeparation(.4);

 leg->AddEntry(h_6,"Data","lpe");//"PL");//"lpe");
 leg->AddEntry(h_2,"MC","F");//"lpe");
 leg->AddEntry(h_0,"W+jets","F");
 leg->AddEntry(h_1,"DY","F");
 leg->AddEntry(h_3,"single Top","F");
 leg->AddEntry(h_4,"Multiboson","F");
 //leg->AddEntry(h_5,"t#bar{t}+V","F");
 leg->Draw();
 gStyle->SetOptStat(0);
}