_ROOT Version: Latest Stable
_Platform: Ubuntu 20.04 Compiler: Not Provided
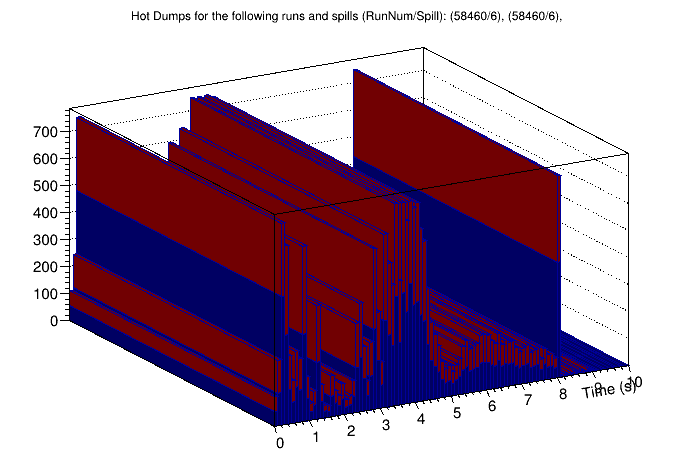
Hi all, I have a THStack of 1D histograms that it like to have stacked in 3d instead of 2d. For example instead of drawing on top of each other stacking in y direction, they are drawn “back-to-back” with some arbitrary width on the z axis and the label of the z axis essentially being the legend.
Okay will do, I’ll leave my function down below (even if it won’t work due to missing functions and .roots etc) which might help you understand how I’m trying to set things up…
TCanvas* MultiPlotRunsAndDumps(std::vector<Int_t> runNumbers, std::string SISChannel, std::vector<std::string> description, std::vector<int> dumpNumbers, bool stack)
{
  std::vector<Int_t> runNumbers = {58460, 58460};
  std::string SISChannel = "SIS_PMT_CATCH_OR";
  std::vector<std::string> description = {"Hot Dump"};
  std::vector<int> dumpNumbers = {6,6};
  bool stack = true;

  //Set up a vector of final histograms to save.
  std::vector<TH1D*> allHistos;

  //Loop through each run inputed.
  for(int i=0; i<runNumbers.size();  i++) {
    Int_t run = runNumbers.at(i);

    //These 3 lines find the SIS channel of the input.
    TSISChannels channelFinder(run);
    int channel = channelFinder.GetChannel(SISChannel.c_str());
    std::vector<int> channels = {channel};

    //Get the spills from the data (should only be the one selected in the dumpNumbers)
    std::vector<TA2Spill> spills = Get_A2_Spills(run, description, {dumpNumbers.at(i)});
    //Get the SIS from the spill, pills the first (and only histo) and adds it to allHistos
    allHistos.push_back( Get_SIS(run, channels, {spills.at(0)}).at(0) );
  }

  //Set up a nice title.
  std::string title = description.at(0);
  title+="s for the following runs and spills (RunNum/Spill): ";
  for(int i=0; i<runNumbers.size(); i++) {
    title+="(";
    title+=std::to_string(runNumbers.at(i));
    title+="/";
    title+=std::to_string(dumpNumbers.at(i));
    title+=")";
    title+=", ";
  }

  //Drawing options. We create a histo stack and then draw that.
  TCanvas *finalCanvas = new TCanvas("finalCanvas","MultiPlot");
  THStack *histoStack = new THStack("histoStack",title.c_str());
  TLegend *legend = new TLegend();
  gStyle->SetPalette(kRainBow);

  //Loop through all histos and stack.
  for(int i=0; i<allHistos.size(); i++) {
    histoStack->Add(allHistos.at(i)); //Add each histo to the stack.
    legend->AddEntry(allHistos.at(i), std::to_string(runNumbers.at(i)).c_str() ); //Add an entry to the legend.
  }

  //We have to draw it first to be able to get the axis. This draw will be overwritten below.
  histoStack->Draw();
  legend->Draw();
  histoStack->GetXaxis()->SetTitle("Time (s)");
  histoStack->GetYaxis()->SetTitle("Counts");

  if(stack)
    histoStack->Draw("pfc hist");
  else
    histoStack->Draw("pfc hist nostack");

  return finalCanvas;
}
Its worth nothing that yes for debugging purposes I am plotting the same hist on top of each other
Hi okay so the macro you posted earler was handy, I thought about making a new axis but didn’t really feel like it was the best option, but I couldn’t get a TGraph to work because as far as I can tell it requirs a function not a histogram…
Anyway so far with your macro and editing it a little bit I’ve managed to plot something like this:
How can I “squish” the z axis? I don’t want the bars to be so long, I’d rather them be more cubish, even if it means having a flat graph. Is this possible?
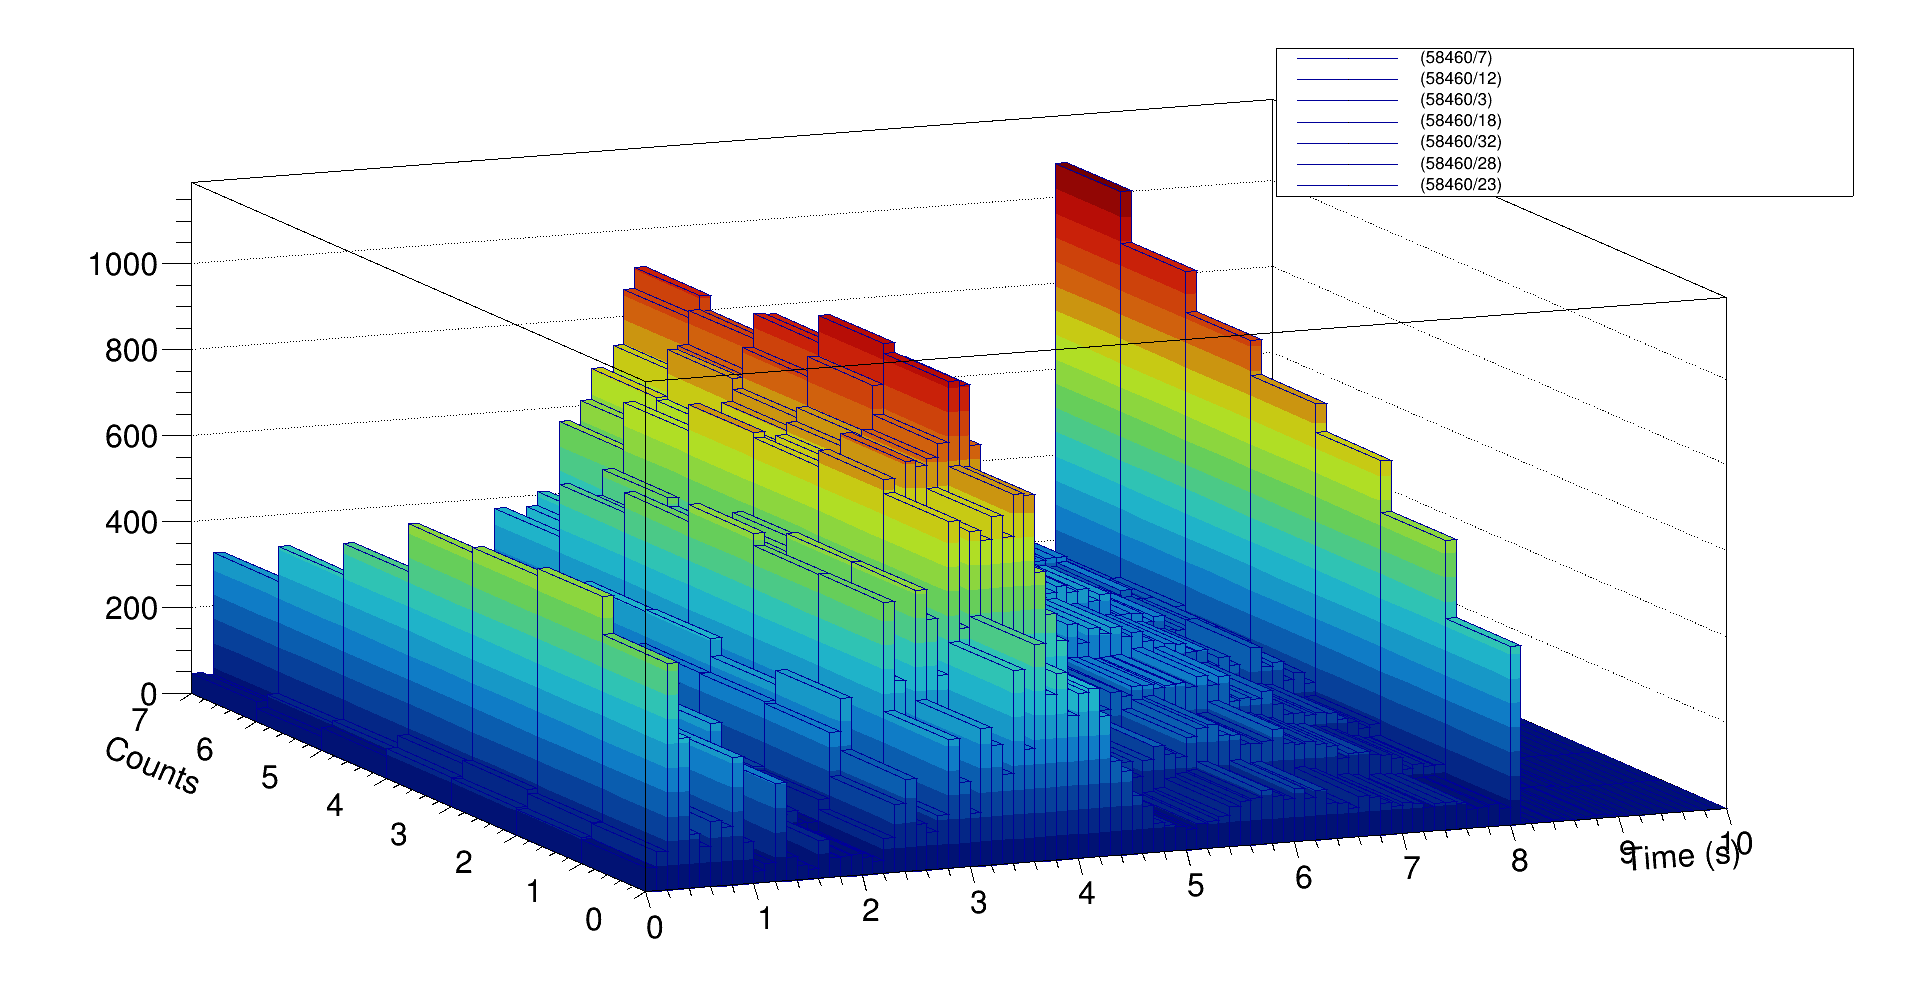
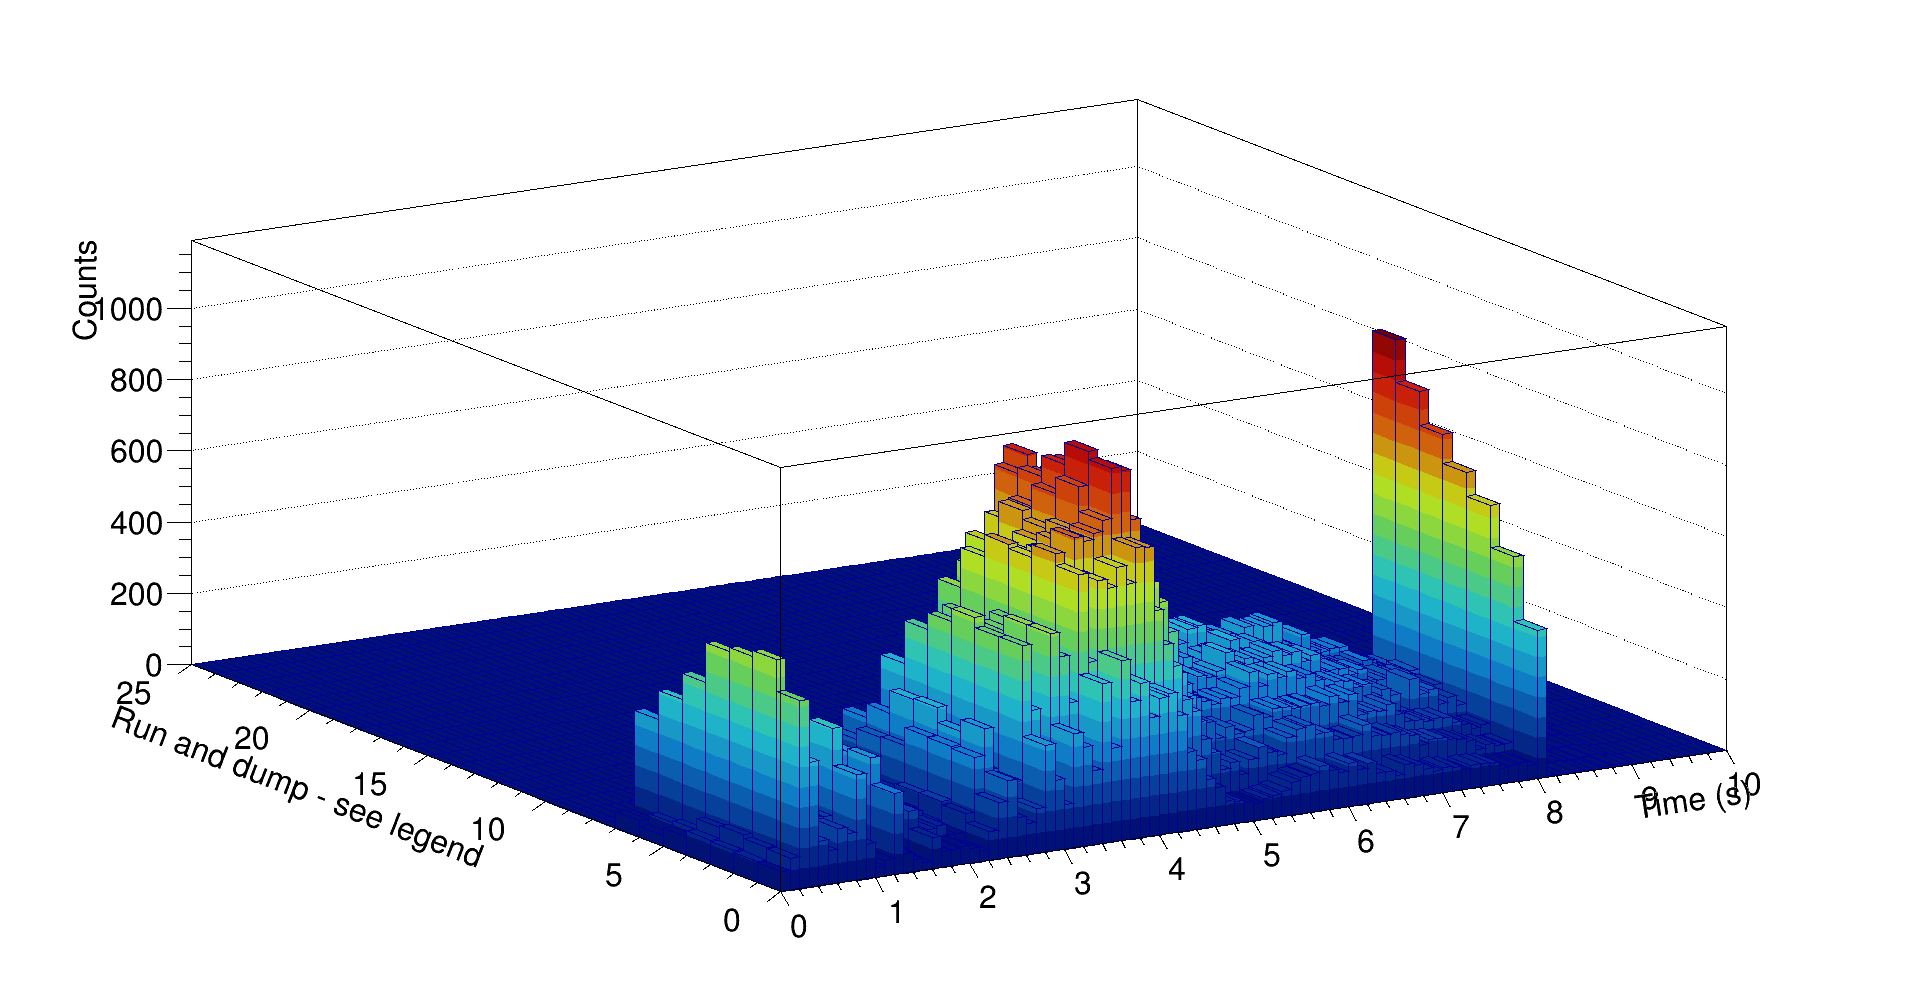
How would I get the legend to work? If for example I wanted this contour plot? Can I display my legend along the z axis instead of an actual axis (I could of course go back to unique colours and have a standard legend - although I haven’t been able to get this to work either - but it would be nice to label along the axis…
Thanks for your help so far (y)
EDIT: I’ve also just realised that I can’t “GetZaxis()” on a THStack to label to the vertical axis? Any ideas? Thanks
This isn’t quite what I want, I want to keep the angle of theta = phi = 30 but also have the legnth of the z axis be shorter in my canvas.
We need the final and the first histograms to be closer together so we can compare them better. Or alternatively I just want every histogram column to be a perfect rectangular cuboid. Can this not be done?