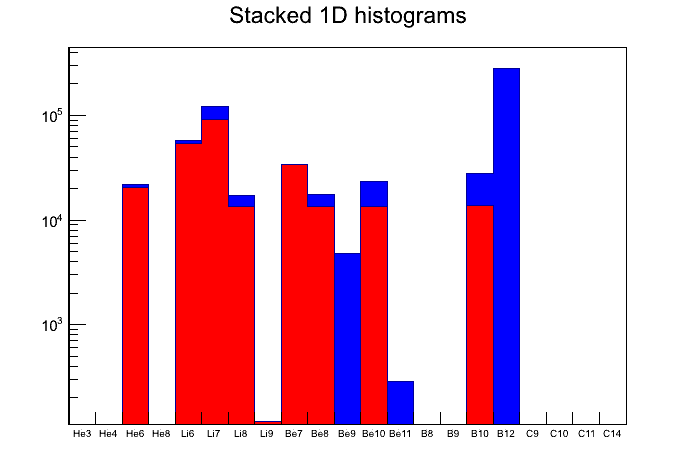
I am trying to plot a stacked bar histograms and to print the value of the total entries on top of each bar/bin, i.e. the sum of the two bins entries for each histogram.
I have attached the plot I produced with this simple script using two created (TH1F) histograms hist and hist2:
Thank you for your reply. I ahve attached the script and the root file used by this script. As I mentioned, hs->Draw(“BAR1 TEXT0”) will show the bin contents for the two histograms sepparately not the total sum… Is it possible to show on top of the two stacked bars the total (sum) value?
I see what you mean. Yes the option TEXT does not work the way you wish with THStack.
May be that could be revisited. Right now the best way would be to make a new histogram
defined as the sum of the histogram you have in the stack and plot it on top of the stack with the
option “TEXT0 SAME”
 .
.