Dear experts,
I am making a stack plot which includes all the Background MC samples. Appropriate snippet of the code:
from PlotterToolsDataMC import *
from ROOT import *
from ROOT import TPad
#gStyle.SetOptStat(0)
#gROOT.SetBatch(kTRUE)
#first loop over all variables
for v in Vars:
   hists = []
   hists2 = []
   leg = TLegend(0.6, 0.8, 0.89, 0.89)

   leg.SetBorderSize(0)
   Max = -0.
   Max2 = -0.
   for fi,f in enumerate(MC):  ## get all MC plots, because they have to stacked!
      ch = TChain('H4GSel')
      ch.Add(f[0])
      hname = v[1]+'_'+str(fi)
      h = TH1F(hname, v[2], v[3], v[4], v[5])
      ch.Draw(v[0]+'>>'+hname,TCut(genCut)) ## add cut based on what you want to plot, blind or unblind or anything else
      #total1 = h.Integral
      #print total1
      h.Scale(float(f[4]),"nosw2")
      #h.Scale(1/float(h.Integral()))
      h.SetLineColor(f[2])
      h.SetLineWidth(2)
      h.SetFillColor(f[3])
      h.Sumw2()
      mc_copy = h.Clone("copy")
      hists.append([h,ch,f[1]])
      if h.GetMaximum() > Max:
         Max = h.GetMaximum()
   c0 = TCanvas('a','a',800,2000)   ##now starts the drawing part, start by stacking all the MC up + add a ratio plot
   SetOwnership(c0,False)
 s = THStack("s","")
   for fi,hh in enumerate(hists):
      #leg.AddEntry(hh[0], hh[2], 'lf')
      s.Add(hh[0])
      #s.Add(h3)
      hh[0].SetMaximum(Max*1.5)
      hh[0].SetMinimum(0.0001)
      if fi == 0:
         hh[0].Draw('')
      if fi > 0:
         hh[0].Draw('same')
      if fi == 0:
         leg.AddEntry(hh[0],hh[2],'lf')
      if fi == 2:
         leg.AddEntry(hh[0],hh[2],'lf')
      if fi == 5:
         leg.AddEntry(hh[0],hh[2],'lf')
      #h_err = TH1F(h_err, h_err, 35, 100,180)
      #h_err.Add(hh[0])
      #h_err.Add(hh[1])
      #h_err.Add(hh[2])
   #s.Add(h3)
   s.Draw("hist E2")
   s.GetXaxis().SetTitle(v[6])
   s.GetYaxis().SetTitle('Normalized Yields')
   s.GetYaxis().SetTitleOffset(1.6)
   s.SetMaximum(100000)
While drawing the histograms for the individual samples I store the sum of the weights and on adding them to the stack, draw the stack with the E2 option.
What I expect to see is the total uncertainty due to all the samples, however the plot being created is showing uncertainties on the individual samples.
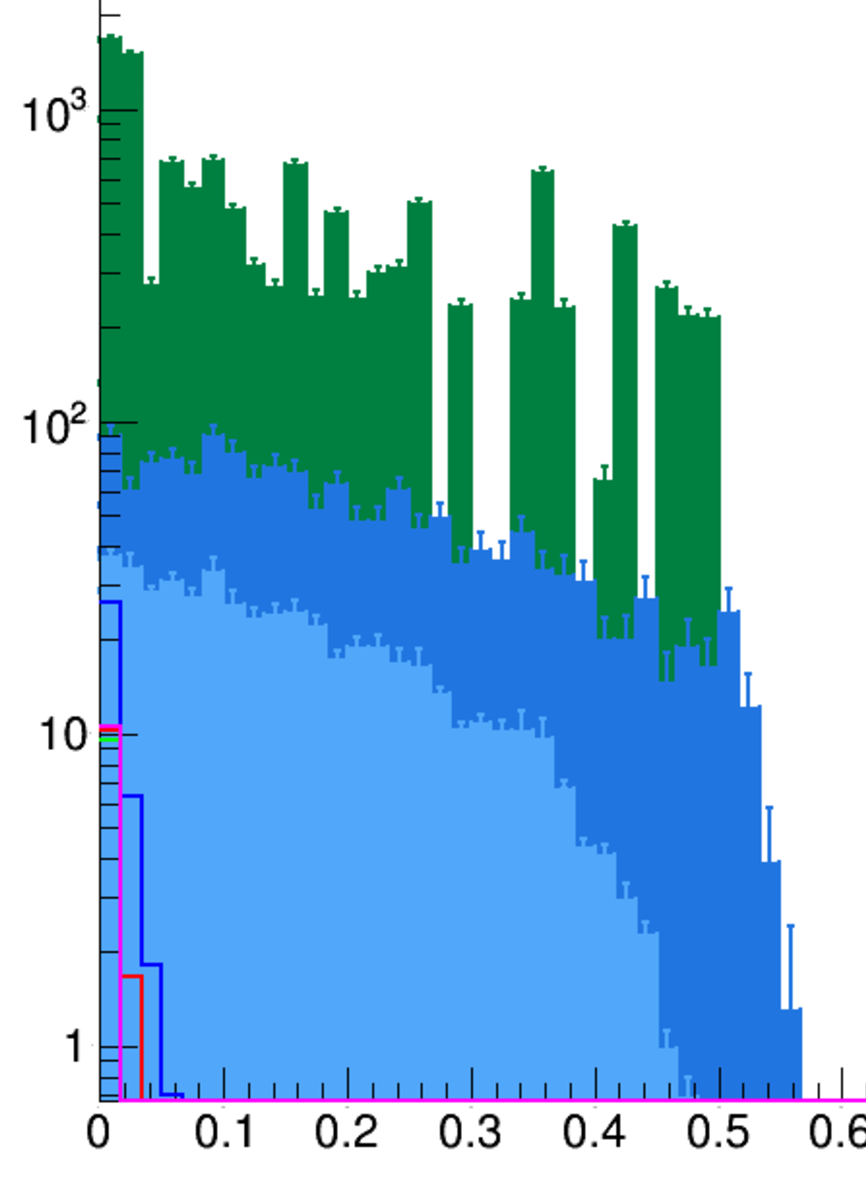
I was under the impression that by means of creating a stack, the E2 draw option would display the total uncertainty.
Is there a bug in my code or is there any other way to achieve this?
Thanks,
Tanvi