Hello,
I generated four samples
pp > h1 ,h1 > tau tau~
pp > h2 ,h2 > tau tau~
pp > z ,z > tau tau~
pp > tau tau~
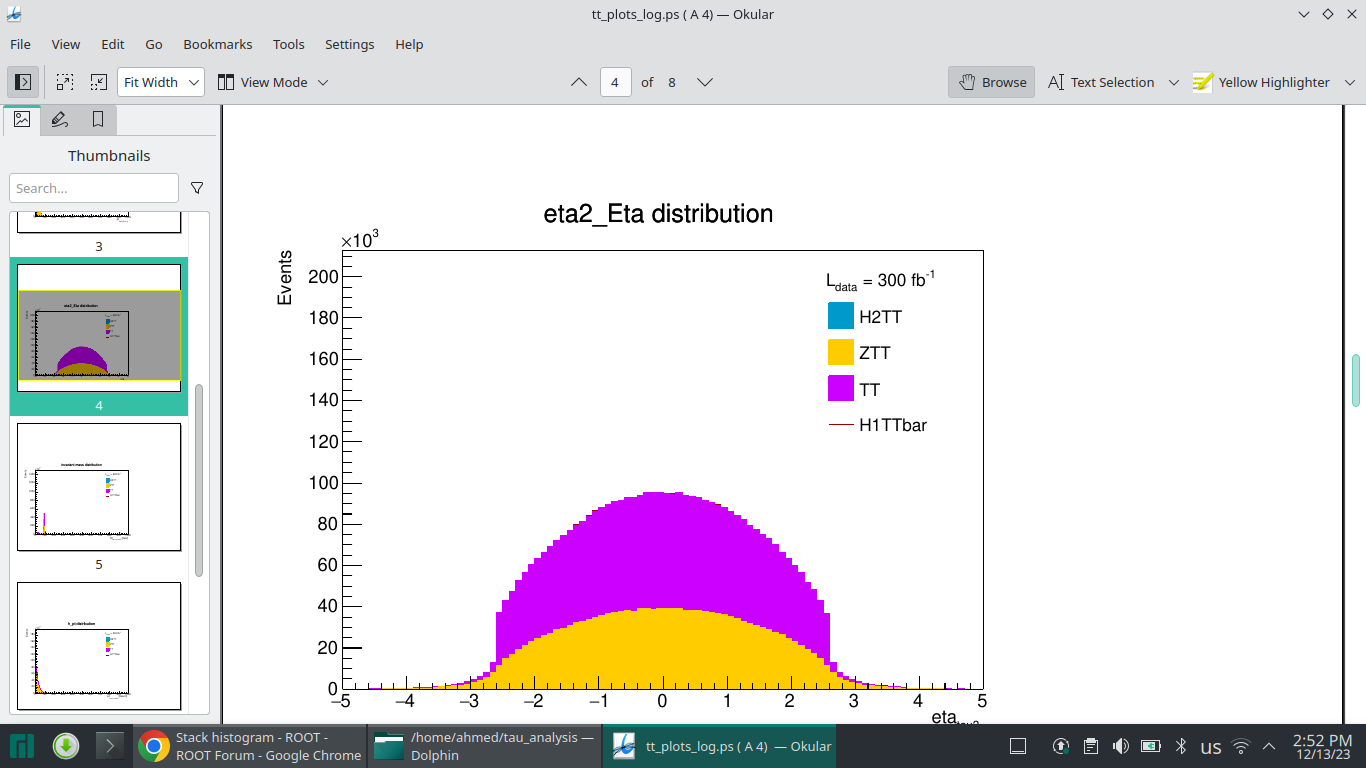
I did a code for all samples. A problem is showed when i Stacked these histograms, i found
the signal and one of bkgs not appeared. I used log scale to appear them but unfortunately not appeared. please I wish to find a solution for this problem
thanks
Ahmed
Knowing that first is signal and the other three are bkgs the i did a code for all these sample
in signal i used BLSSM model and paramter_card file (within compressed BLSSM) which is attached below and for bkgs i used model sm-full . BLSSM model signal
It is not clear from your description what the problem is. Are you trying to draw the histograms using THStack perhaps? See this tutorial for a nice starting point. In general, if you can provide us with a minimal code snippet to see the problem it would be greatly beneficial.
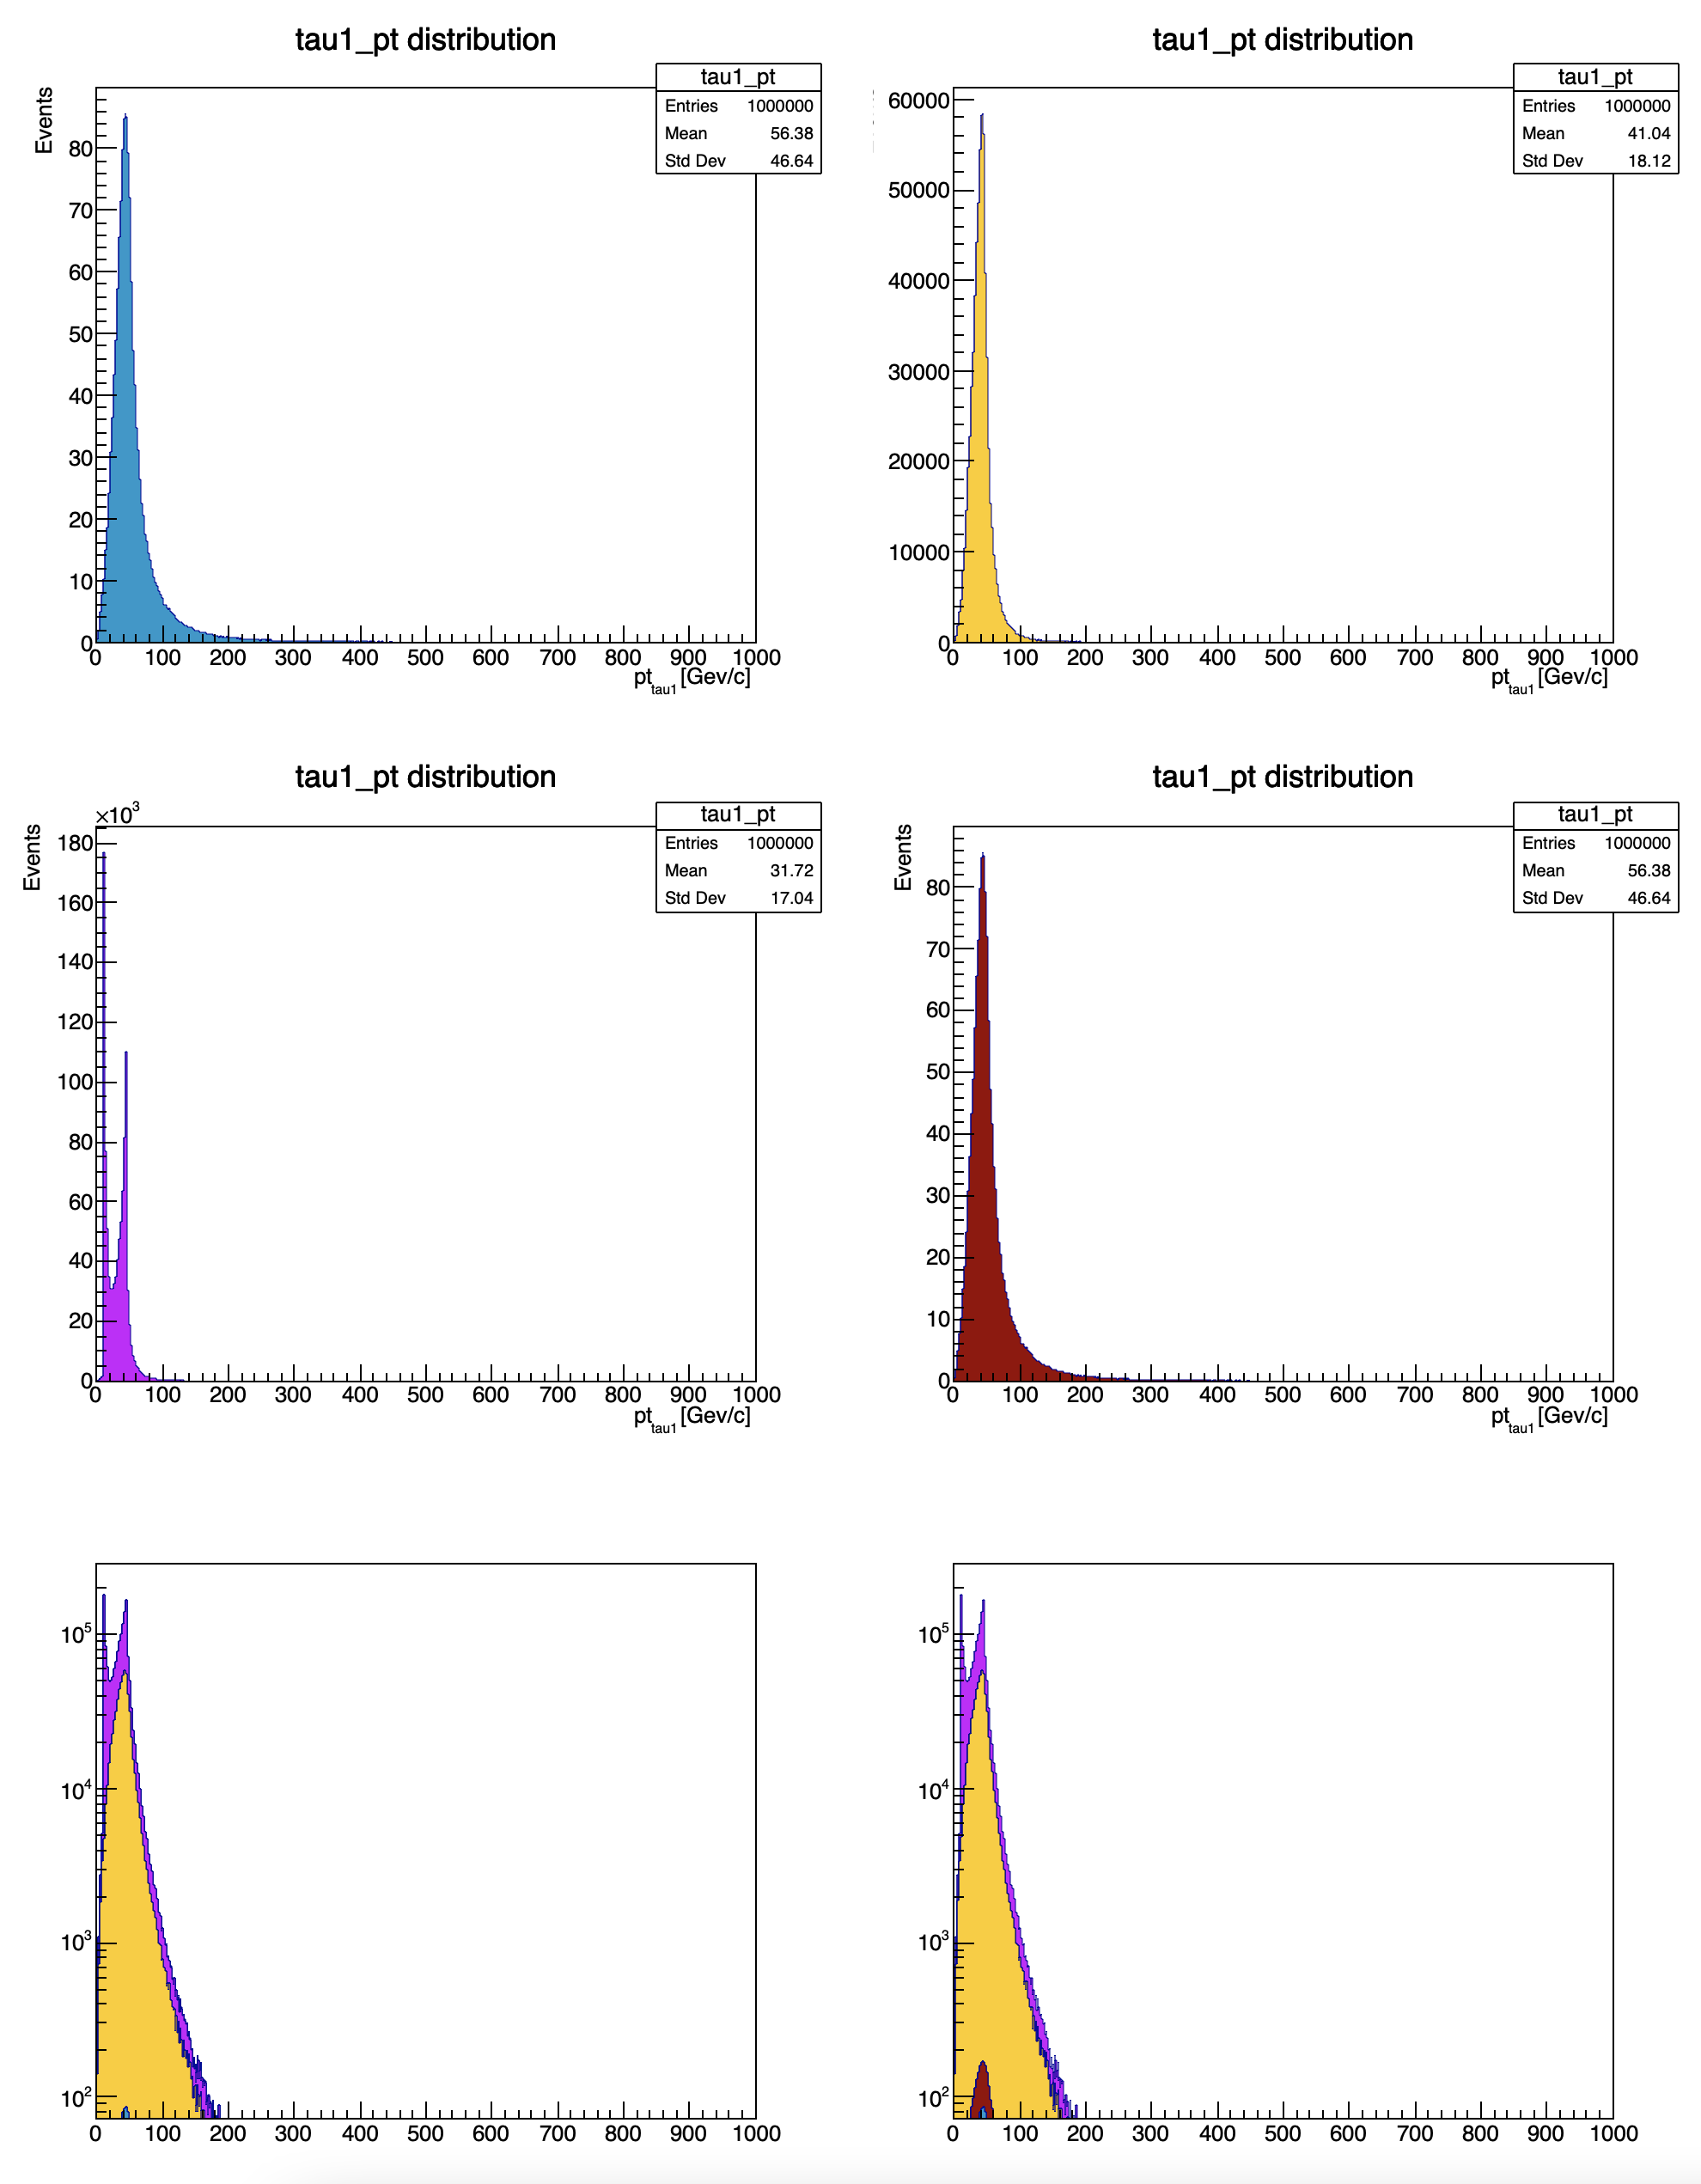
On this plot, the four first pads show the histograms h0, h1, h2 and h3 (in that order). On pad 5 the stack shows the histograms in the order you have them in your original macro. On pad 6 that’s an other stack in which the histograms with the lower dynamic (h0 and h3) are plotted first (in a stack the histograms are plotted in the order you added them). As you can see in the 1st stack (yours…) you can see h0 but not h3 and in the 2nd stack you can see both.
EDIT:
In the 1st stack (your case) you pile the four histograms this way:
h0 → small Y dynamic
h1 → Very high Y dynamic
h2 → Very high Y dynamic
h3 → small Y dynamic
so the 4th histogram, h3, is on top of two histogram with a very high Y dynamic therefore it is completely negligeable in the decade it shows up. So you should make sure you pile the histograms starting with those having the smallest maximum.
May be we can think of making this ordering (from lowest to highest maximum) automatic when the pad is in log scale ?