Dear experts, I have a question about the Splot function of ROOT with fixed yields.
In my analysis, I am performing a simultaneous fit between two categories, which we can call category A and category B. Category A is what I am interested in splotting as my signal lies in that phase space.
In category B I have the following yields:
-
pk signal: floating
-
combinatorial background: floating
In category A I have the following yields:
-
signal yield: floating
-
combinatorial background yield: floating
-
misid 1 background yield: fixed to
pk signalfrom categoryB* constant number (this yield is basically the main reason why I am simultaneously fitting) -
misid 2 (B0) background yield: gaussian constrained
The way I have been splotting is the following:
#first I fit my simultaneous pdf to my combined cat A and cat B data
fit_results = simPdf.fitTo(comb_data, R.RooFit.Save(True))


# I build my floating yields
nsig = R.RooRealVar("nsig", "nsig", fit_result.floatParsFinal().find("N_{sig}").getVal(), 0, fit_result.floatParsFinal().find("N_{sig}").getVal()*10)
ncomb = R.RooRealVar("ncomb", "ncomb", fit_result.floatParsFinal().find("N_{comb,1}").getVal(), 0, fit_result.floatParsFinal().find("N_{comb,1}").getVal()*10)

#Then i build yields that are fixed but still RooRealVars
scale_pK = ws_rare.var("scale_pK")
nmisid1 = R.RooRealVar("nmisid1", "nmisid1", scale_pK.getVal() * fit_result.floatParsFinal().find("N_{misid,2}").getVal())
n_b0 = R.RooRealVar("n_b0", "n_b0", ws_rare.function("N_{B0}").getVal())

#Then i build my pdf from category A (dropping the simultaneity then as I am "fixing" the yield that depends on category B)
pdf = R.RooAddPdf("pdf", "pdf", R.RooArgList(pdf_ppi.getComponents().find("DSCBsignalfixed_gaussiansignalfixed"), pdf_ppi.getComponents().find("exponentialcomb_fit1"), pdf_ppi.getComponents().find("misid_pkfixed"), pdf_ppi.getComponents().find("B0_model")), R.RooArgList(nsig, ncomb, nmisid1, n_b0))

#Finally I define my splot
sData = R.RooStats.SPlot(
                "splot_data", "splot_data",
                data_ppi, pdf,
                R.RooArgList(nsig, ncomb, nmisid1, n_b0)
                )
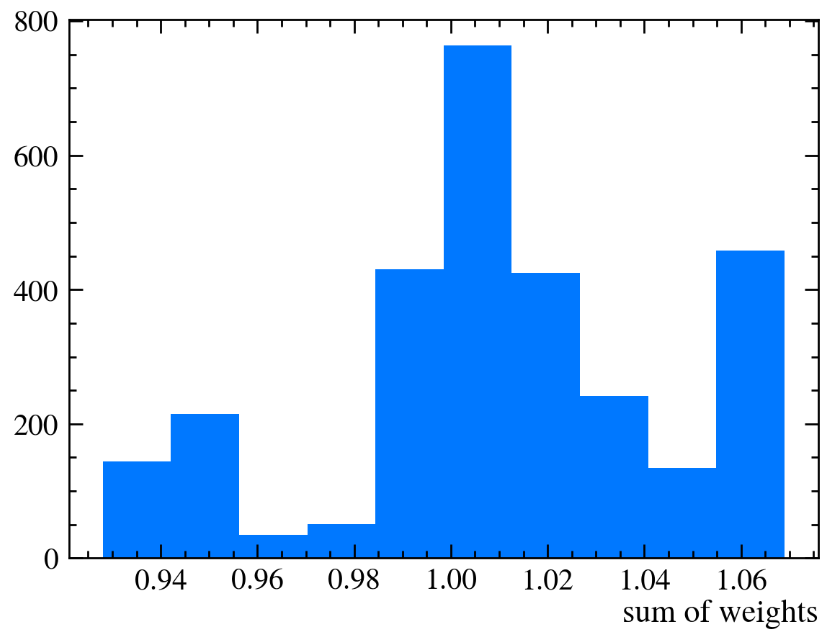
The code runs and produces an output, with the sum of the weights in each event close to a Gaussian centred at 1, but with a wide spread (as shown in the picture). I am not sure if this is the expected output. I am also not fully sure that the Splotclass can be used with fixed yields as I did. I tried searching for more information, but I could not find it on the Splot class page. I would appreciate any help in determining whether this is the correct way to use the class.
Thank you in advance,
Piera