Hello people.
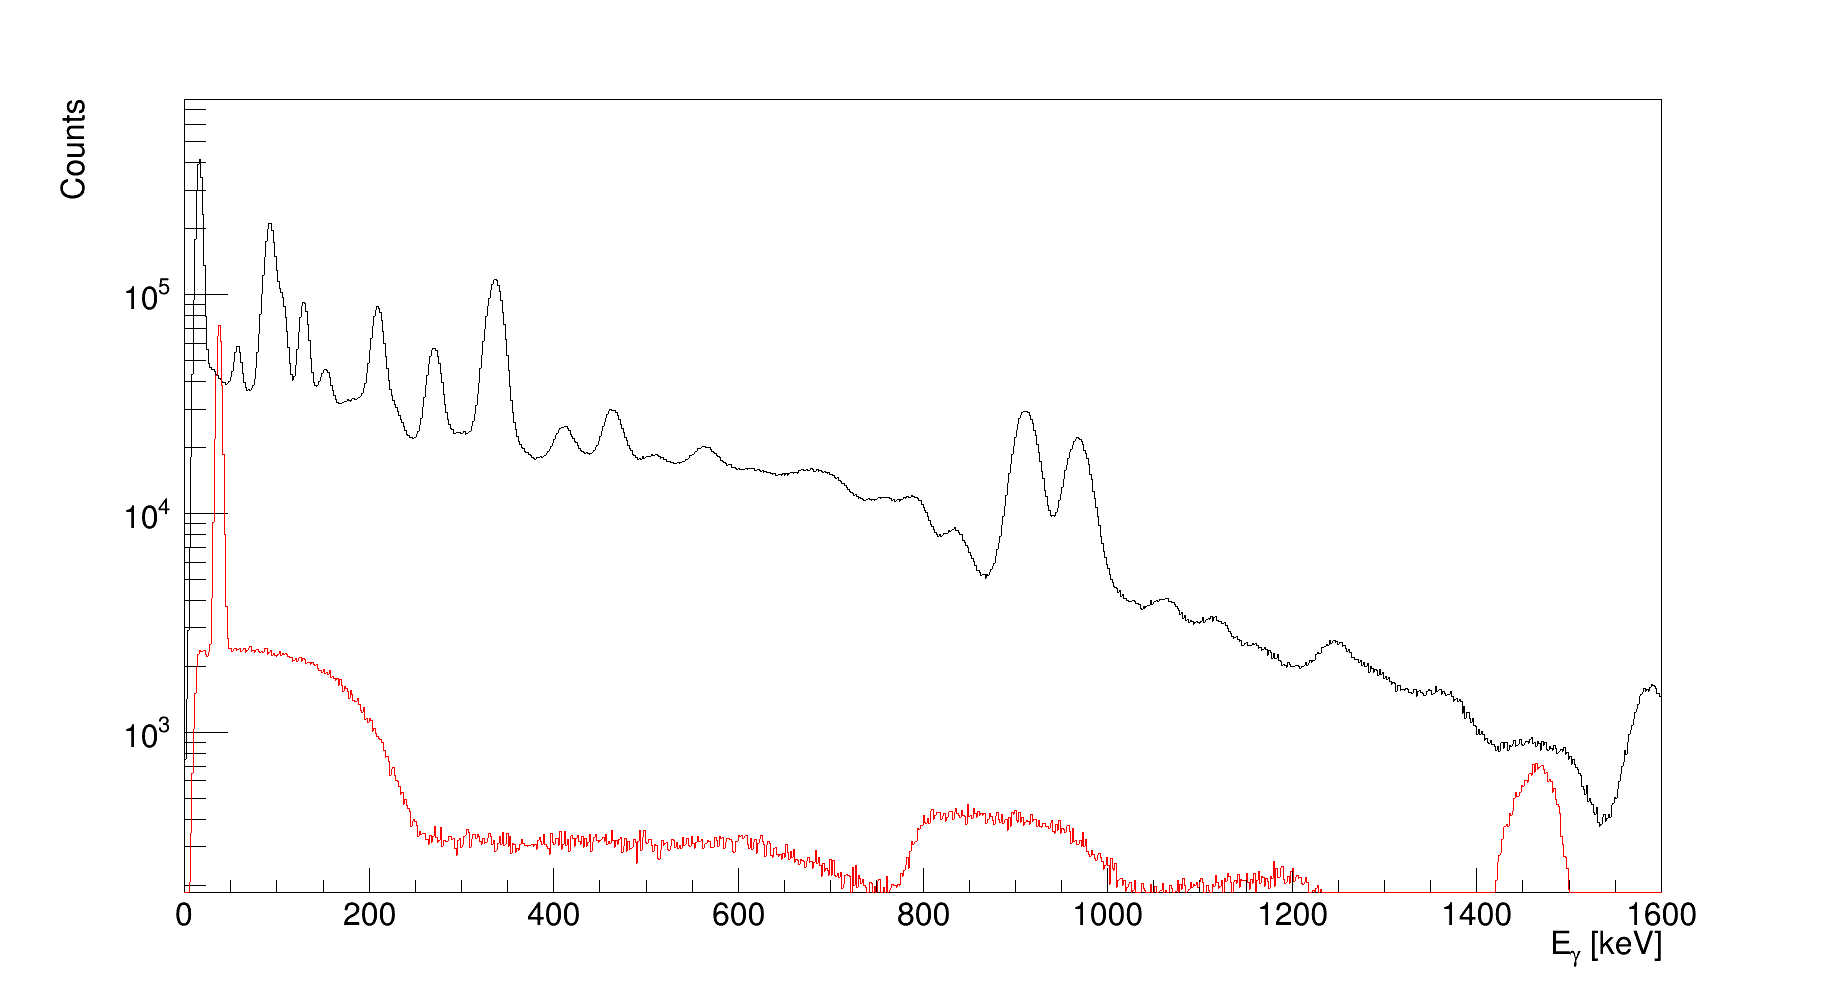
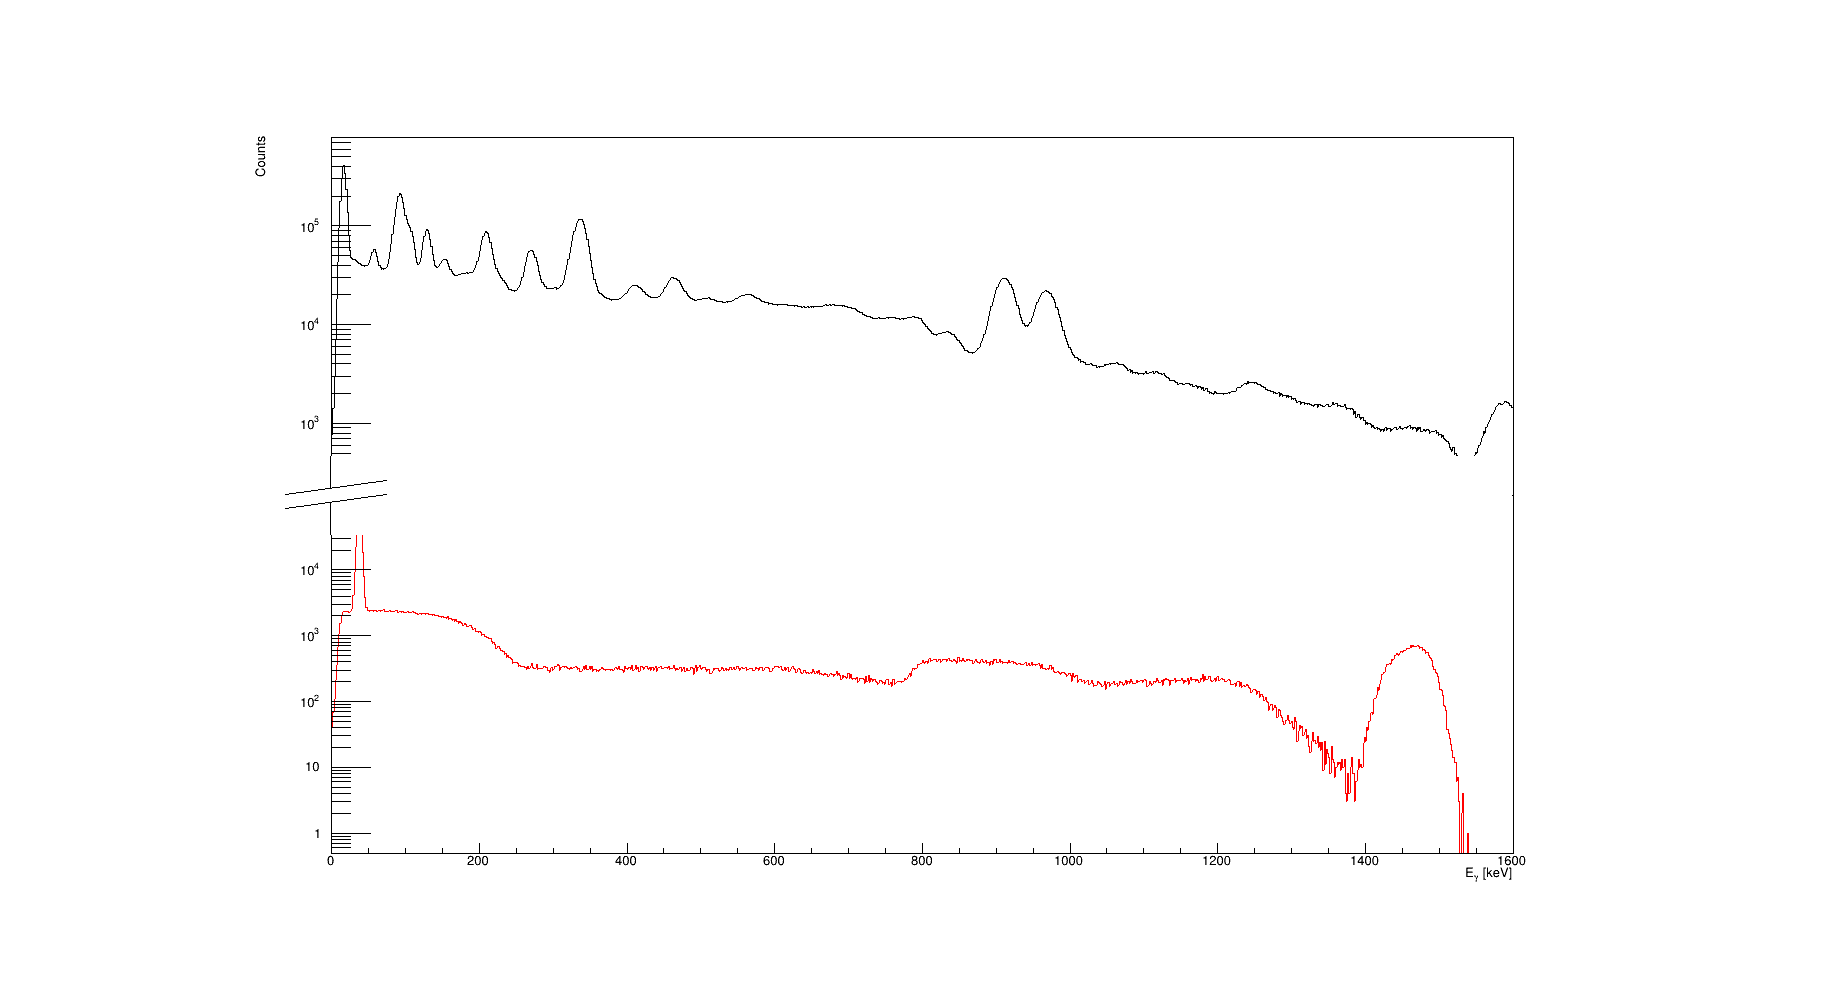
I am trying to “split” the Y axis by creating two different pads and placing them end to end. Here is the plot.
I modified my code from BrokenAxis() shared by @couet in the “Remove some axis in a TPad” thread.
It works well. However, it would be great if the Y axis in the top pad starts from after where the Y axis In the below plot ends to make it look more “continuous.” I am trying to use the SetUserRange() method, but it does not cause any change in the axis range.
Can someone please suggest how to overcome this?
   [code]

   TCanvas *c = new TCanvas("c", "c",700,900);

   TPad *p1 = new TPad("p1","p1",0.1,0.5,0.9,0.901);
   p1->SetBottomMargin(0.);
   p1->SetBorderMode(0);
   p1->Draw();

   TPad *p2 = new TPad("p2","p2",0.1,0.1,0.9,0.501);
   p2->SetTopMargin(0.);
   p2->SetBorderMode(0);
   p2->Draw();

   // Create a histogram for the values we read.
   auto myHist = new TH1F("h1","",1000,0,1600);
   myHist->SetXTitle("E_{#gamma} [keV]");
   myHist->SetYTitle("Counts");

   [code]
	   myHist->Fill(1000*(*myPx));

   }
   p1->cd();
   myHist->SetLineColor(kBlack);
   myHist->Draw();
   p1->SetLogy();

[code]

   // Create a histogram for the values we read.
   auto myHist2 = new TH1F("h2","",1000,0,1600);
   myHist2->SetXTitle("E_{#gamma} [keV]");
   myHist2->SetYTitle("Counts");
[code]

    	  myHist2->Fill(*myPx2*1000);
[code]

   p2->cd();
   myHist2->SetLineColor(kRed);
   myHist2->Draw("same");
   p2->SetLogy();

    c->cd();
   TPad *b = new TPad("b","b",0.1,0.46,0.8199,0.54);
   b->SetBorderMode(0);
   b->Draw();
   b->cd();
   TLine *line = new TLine(0.11,0,0.1105677,0.399656);
   line->Draw();
   line = new TLine(0.1105677,0.5860092,0.11,1);
   line->Draw();
   line = new TLine(0.076639,0.5143349,0.1524797,0.6863532);
   line->Draw();
   line = new TLine(0.076639,0.3423165,0.1524797,0.5143349);
   line->Draw();
}
Please let me know for further clarifications from my side.
Thanks a lot