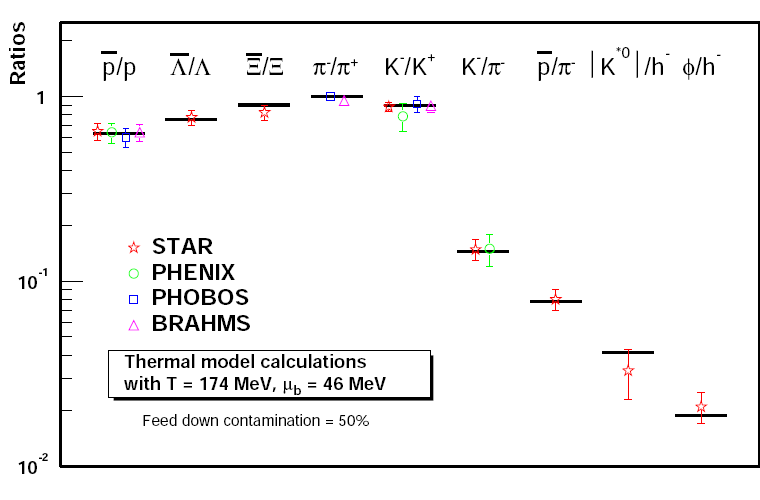
How is it possible to get Markers like in the picture (the long black lines) because in TAttMarker I found only point like styles…
how is it possible to set particle names like pi or eta on the x-axis? instead of other labeling…
How can I change the label-step size of an axis, if I want for example only the highest and the lowest value (10 and 0 instead on 10,9,8,7,6,5,4,3,2,1).
is there a good tutorial where I can find all this stuff, because there are only a few tutorials in the internet available and all of them are very basic…
thanks for help
best regards
florian
Change the number of divivions:
Graph->GetXaxis()->SetNdivisions(502);
$ROOTSYS/tutorials.
An other good way to learn all this is to modify the canvas ouput interactively and save the result in a .C file (menu File/Save in the canvas). This technique makes sense only if you do before View/Editor.