Hi!
I’m writing a script that read the x and weight values from an input file and make a histrogram with those values.
This is the script, really simple:
void plotter(string input)
{
	TCanvas *c = new TCanvas("name", "canvas", 800, 500);
	TH1D *h1 = new TH1D("histo", "title", 161, 1.0000E-12, 1.0000E+04);
	gPad->SetLogx();
	double x;
	double w;
	string line;

	ifstream file_input (input.c_str());
	while ( getline(file_input, line) )
	{
		stringstream(line) >> x >> w;
		h1->Fill(x, w);
	}
	h1->Draw("HIST");
}
And this is the input file:
1.00E-012 1
1.26E-012 2
1.58E-012 3
2.00E-012 4
2.51E-012 5
3.16E-012 6
3.98E-012 7
5.01E-012 8
6.31E-012 9
7.94E-012 10
1.00E-011 11
1.26E-011 12
1.58E-011 13
2.00E-011 14
2.51E-011 15
3.16E-011 16
3.98E-011 17
5.01E-011 18
6.31E-011 19
7.94E-011 20
1.00E-010 21
1.26E-010 22
1.58E-010 23
2.00E-010 24
2.51E-010 25
3.16E-010 26
3.98E-010 27
5.01E-010 28
6.31E-010 29
7.94E-010 30
1.00E-009 31
1.26E-009 32
1.58E-009 33
2.00E-009 34
2.51E-009 35
3.16E-009 36
3.98E-009 37
5.01E-009 38
6.31E-009 39
7.94E-009 40
1.00E-008 41
1.26E-008 42
1.58E-008 43
2.00E-008 44
2.51E-008 45
3.16E-008 46
3.98E-008 47
5.01E-008 48
6.31E-008 49
7.94E-008 50
1.00E-007 51
1.26E-007 52
1.58E-007 53
2.00E-007 54
2.51E-007 55
3.16E-007 56
3.98E-007 57
5.01E-007 58
6.31E-007 59
7.94E-007 60
1.00E-006 61
1.26E-006 62
1.58E-006 63
2.00E-006 64
2.51E-006 65
3.16E-006 66
3.98E-006 67
5.01E-006 68
6.31E-006 69
7.94E-006 70
1.00E-005 71
1.26E-005 72
1.58E-005 73
2.00E-005 74
2.51E-005 75
3.16E-005 76
3.98E-005 77
5.01E-005 78
6.31E-005 79
7.94E-005 80
1.00E-004 81
1.26E-004 82
1.58E-004 83
2.00E-004 84
2.51E-004 85
3.16E-004 86
3.98E-004 87
5.01E-004 88
6.31E-004 89
7.94E-004 90
1.00E-003 91
1.26E-003 92
1.58E-003 93
2.00E-003 94
2.51E-003 95
3.16E-003 96
3.98E-003 97
5.01E-003 98
6.31E-003 99
7.94E-003 100
1.00E-002 101
1.26E-002 102
1.58E-002 103
2.00E-002 104
2.51E-002 105
3.16E-002 106
3.98E-002 107
5.01E-002 108
6.31E-002 109
7.94E-002 110
1.00E-001 111
1.26E-001 112
1.58E-001 113
2.00E-001 114
2.51E-001 115
3.16E-001 116
3.98E-001 117
5.01E-001 118
6.31E-001 119
7.94E-001 120
1.00E+000 121
1.26E+000 122
1.58E+000 123
2.00E+000 124
2.51E+000 125
3.16E+000 126
3.98E+000 127
5.01E+000 128
6.31E+000 129
7.94E+000 130
1.00E+001 131
1.26E+001 132
1.58E+001 133
2.00E+001 134
2.51E+001 135
3.16E+001 136
3.98E+001 137
5.01E+001 138
6.31E+001 139
7.94E+001 140
1.00E+002 141
1.26E+002 142
1.58E+002 143
2.00E+002 144
2.51E+002 145
3.16E+002 146
3.98E+002 147
5.01E+002 148
6.31E+002 149
7.94E+002 150
1.00E+003 151
1.26E+003 152
1.58E+003 153
2.00E+003 154
2.51E+003 155
3.16E+003 156
3.98E+003 157
5.01E+003 158
6.31E+003 159
7.94E+003 160
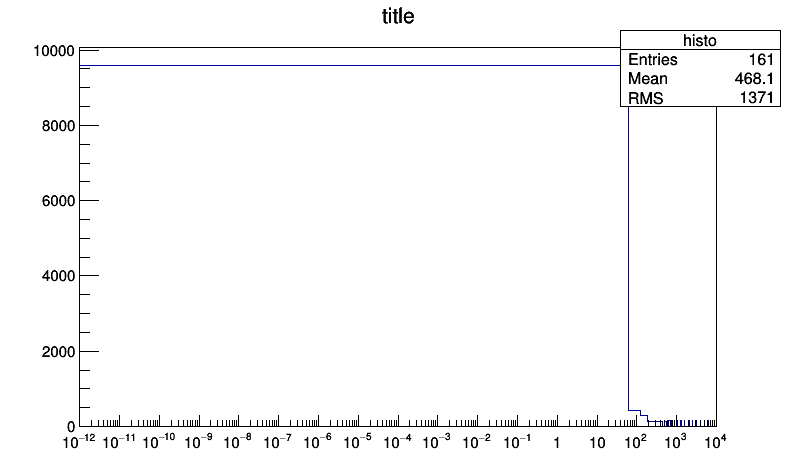
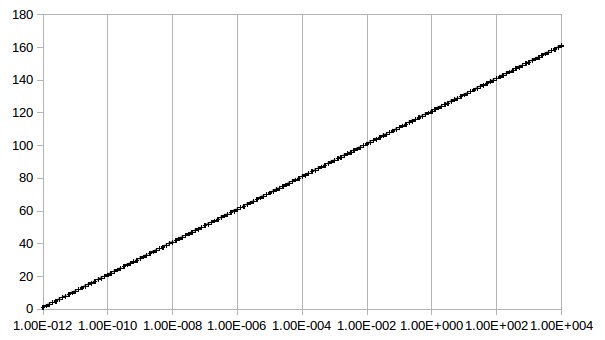
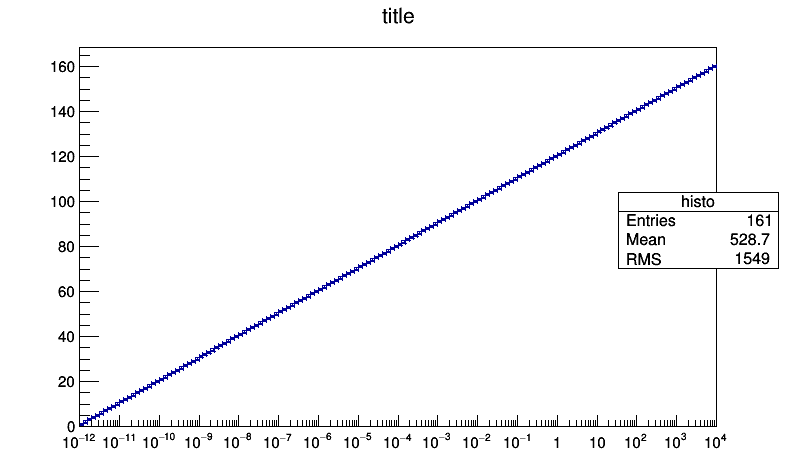
1.00E+004 161The result is completely different from what I expected. As you can see in the attachments, I made a comparison between the histrogram made by root and a graph with the same input file made by excel.
Why my script completely messes up the histrogram…? o.O
I really don’t understand what’s wrong.
Can you help me, please?