Hi,
I have a few questions on Contour plots. Basically, I am learning to make contour plots.
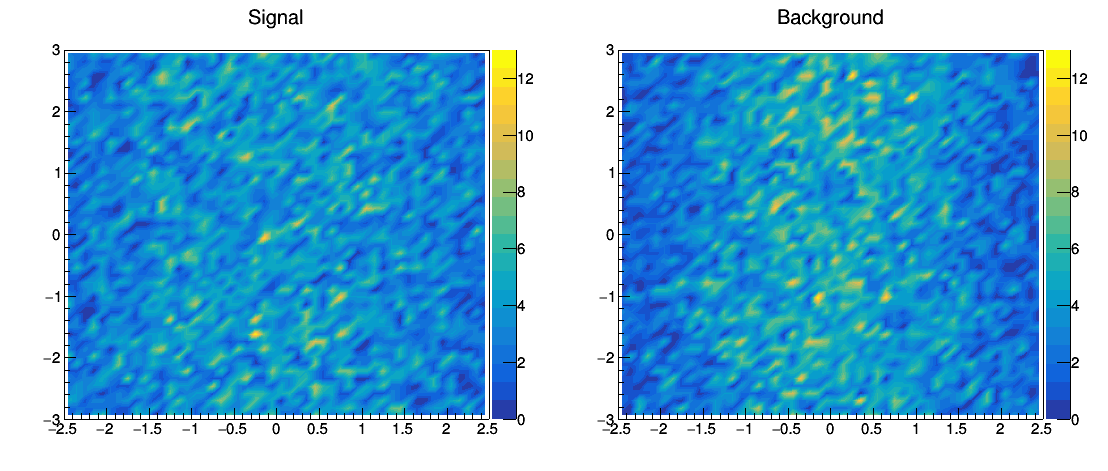
I was trying to make a contour plot from a Delphes output ROOT file. I wanted the as Z-axis the event numbers or the constituent particle number of that branch. I am not sure which variable it’s taking as the Z-axis, but it cannot be the number of events. How to set Z-axis as the number of events. I have attached a Sample macro and a Dropbox link to the ROOT files. Also, I am attaching the contour that I could make. SampleMacro.C (1.6 KB) ROOT Files
I have an ASCII file with three columns. The first two columns are two variables and the third column is the function of them. I want to plot a contour of the two variables with the 3rd column as the Z-axis. How to do that? I am also attaching a small sample data file. data.txt (2.8 KB)
Thanks, Wile.
Yes, that I noticed. The thing is that when I was plotting Eta and Phi 1-D histograms, they were okay as you already know. But when I am trying to plot contour why the z-axis is taking such a range of values? In the input ROOT files there are more than 9k events for Photon.
Do have any idea?
Your “signalSP.root” has 10000 entries in the “Delphes” tree.
You create a 50 bins x 50 bins histogram which means that in average you can expect 4 entries per bin.
Thank you so much, Wile. This is working fine. Just one question: if I have more than 3 columns then should I do the same thing as in TGraph1D to read the columns, i.e., TGraph2D *g = new TGraph2D("data.txt", "%*lg %lg %lg %lg %*lg"); or anything else?
Hi Wile and Olivier,
Sorry to again bother you on the same topic. When I tried the above commands as a macro it worked fine with a data file with only 3 columns. But when I tried running the same macro with a data file with multiple columns and selecting specific columns it gives error messages.
Error in <TGraph2D::Paint>: Empty TGraph2D
I am attaching both the data file and the macro. Can you tell me what’s wrong here? data.txt (2.8 KB) not_working.txt (247.2 KB) Test.C (199 Bytes)
NOTE that when I’m working with the file ‘working.txt’, I am deleting the first %*lg in line-2.
Thanks, Olivier and Wile. Both the suggestions working like charm.
In particular, I liked command suggested by Olivier. It’ll save me a lot of time in other cases also. But also, I noticed that in the new file it’s replacing the column separator from ‘tab’ to ‘space’. Is that expected?
Anyway, thanks a lot.