Hello,
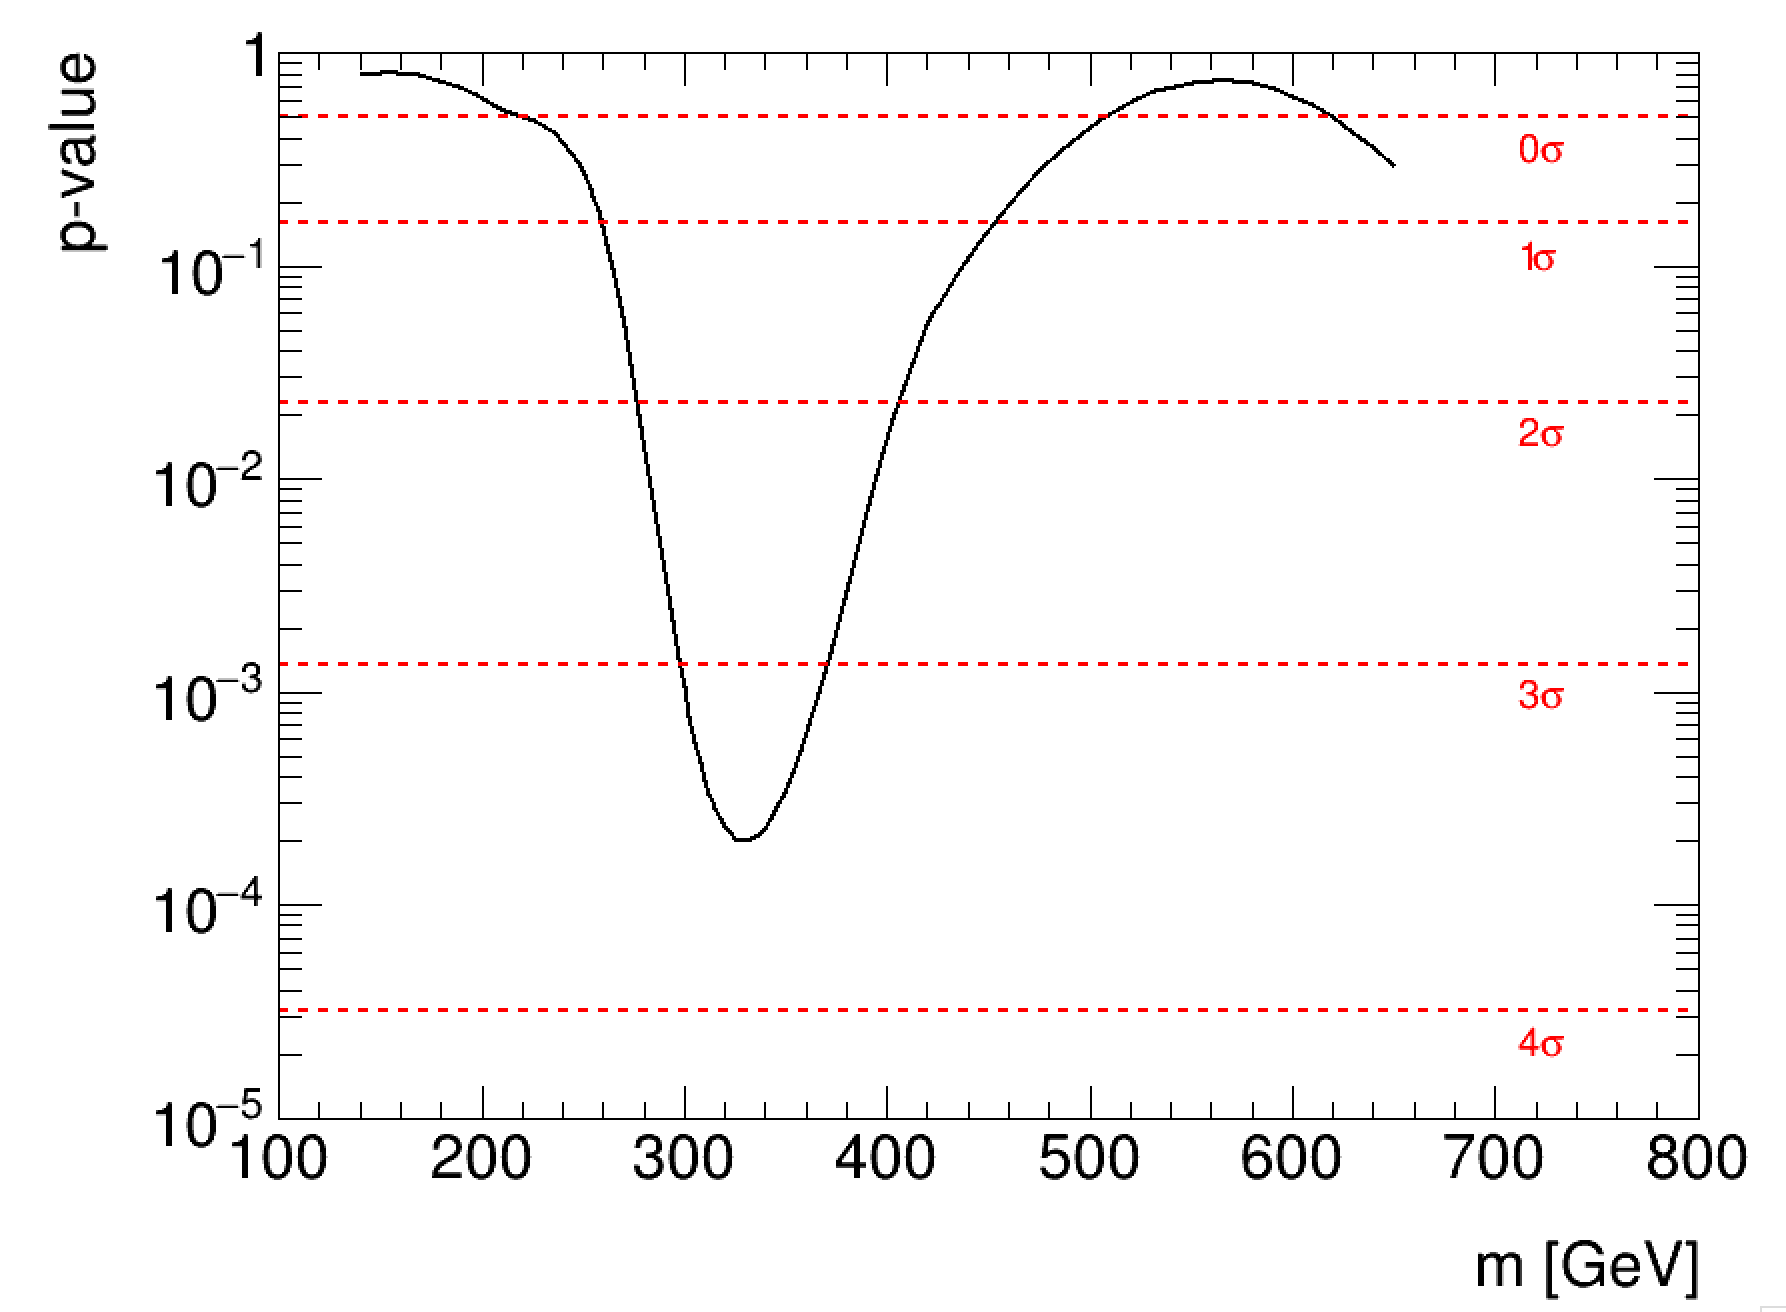
I am trying to plot the bin contents of TH1F using the Draw(“C”) option. But it looks like curve doesn’t represent the contents correctly. I have 6 bins and except for the first two bin entries, none of the other contents are above 0.5 but that is not what is shown by the curve. I would like to draw something similar to the plot shown on slide #35. That plot has more bins but I have only a few. I want the curve to show the entries correctly and the bin edges to be identified more clearly.
My code is given below and the plot obtained is attached.
Also, I am manually adding the position of the TLatex at the moment. How can I fix it to appear above the TLines so that if I change the Y axis, the TLatex entries still appear above the lines?
Thanks in advance for your help!
void plot(){

gStyle->SetOptTitle(0);

int nBins = 6;
float xEdges[7] = {100., 180., 230., 280., 350., 500., 800.};
float pvalues[6] = {0.7841, 0.5756, 0.2115, 0.0002855, 0.06586, 0.2903};

TCanvas *c1 = new TCanvas("nc1","",900,700);
TH1F *hist = new TH1F ("histpvalues","",nBins,xEdges);

for(int i=1;i<=nBins;i++){
   hist->SetBinContent(i,pvalues[i-1]);
}
hist->GetYaxis()->SetTitle("p-value");
hist->GetXaxis()->SetTitle("m [GeV]");
hist->SetMaximum(1);
hist->SetMinimum(10e-6);
hist->Draw("C");

TLatex *tl = new TLatex();
tl->SetNDC();
//tl->SetTextFont(32);
tl->SetTextColor(kRed);
tl->SetTextSize(0.032);
tl->SetTextAlign(12);

tl->DrawLatex(0.85,0.88,"0#sigma");
tl->DrawLatex(0.85,0.80,"1#sigma");
tl->DrawLatex(0.85,0.67,"2#sigma");
tl->DrawLatex(0.85,0.475,"3#sigma");
tl->DrawLatex(0.85,0.218,"4#sigma");

TLine *line0 = new TLine(100,0.5,800,0.5);
   line0->SetLineWidth(2);
   line0->SetLineColor(kRed);
   line0->SetLineStyle(7);

TLine *line1 = new TLine(100,0.158655,800,0.158655);
   line1->SetLineWidth(2);
   line1->SetLineColor(kRed);
   line1->SetLineStyle(7);

TLine *line2 = new TLine(100,0.0227501,800,0.0227501);
   line2->SetLineWidth(2);
   line2->SetLineColor(kRed);
   line2->SetLineStyle(7);

TLine *line3 = new TLine(100,0.0013499,800,0.0013499);
   line3->SetLineWidth(2);
   line3->SetLineColor(kRed);
   line3->SetLineStyle(7);

TLine *line4 = new TLine(100,3.16713e-05,800,3.16713e-05);
   line4->SetLineWidth(2);
   line4->SetLineColor(kRed);
   line4->SetLineStyle(7);


c1->SetLogy();
line0->Draw("same");
line1->Draw("same");
line2->Draw("same");
line3->Draw("same");
line4->Draw("same");
gPad->RedrawAxis();
}