Hello,
I do have a practical copy of the spline example, and it does not draw me a spline!
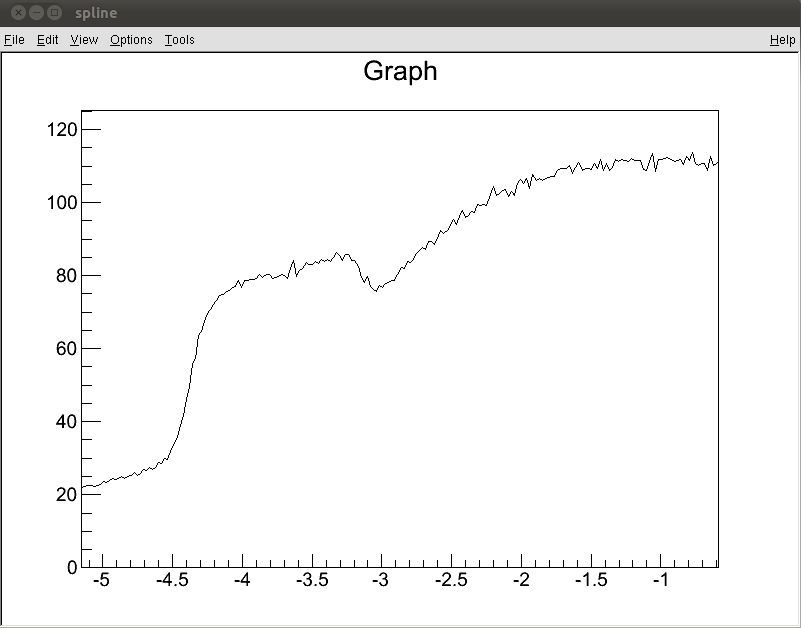
It does draw the TGraph within the correct area inside the canvas.
In general, this area is not very well-documented… If someone has examples of using splines to smooth the data from jitter etc., that will be most appreciated! Fitting is not really an option as the data spectra are rather chaotic set of peaks & dips 
Thanks, EG
[code]//=========================== spline.C ==================================
void spline(){
TCanvas *c1 = new TCanvas(“c1”,“spline”,100,80,800,600);
TGraphErrors *gr_test = new TGraphErrors(“data.txt”, “%lg %lg”, “gr_test”);
gr_test->Sort(); // test is just a set of x,y two columns, tab delimited.
//— make some dummy plot for the canvas to draw graph in
// I use 100 bins so I’d be able to zoom in later on by hand
TH2F *h_dummy = new TH2F(“h_dummy”,“Dummy Name”, 100, -20.,20., 100, 0., 120.);
h_dummy->SetStats(kFALSE);
TSpline3 *grs_test = new TSpline3(“grs_test”, gr_test);
grs_test->SetLineColor(kRed);
h_dummy->Draw();// just a dummy to make output look pretty and within desired intervals x,y
gr_test ->Draw(“P same”); // Points in blue
grs_test->Draw(“L same”); // Should be spline line in red which is not there!
c1->Update();
}[/code]
data.txt (17.5 KB)