Can someone please help me with signal-to-noise enhancement plot?
Here is my code:
TCanvas *c = new TCanvas();
double_t x;
double_t L = 50;
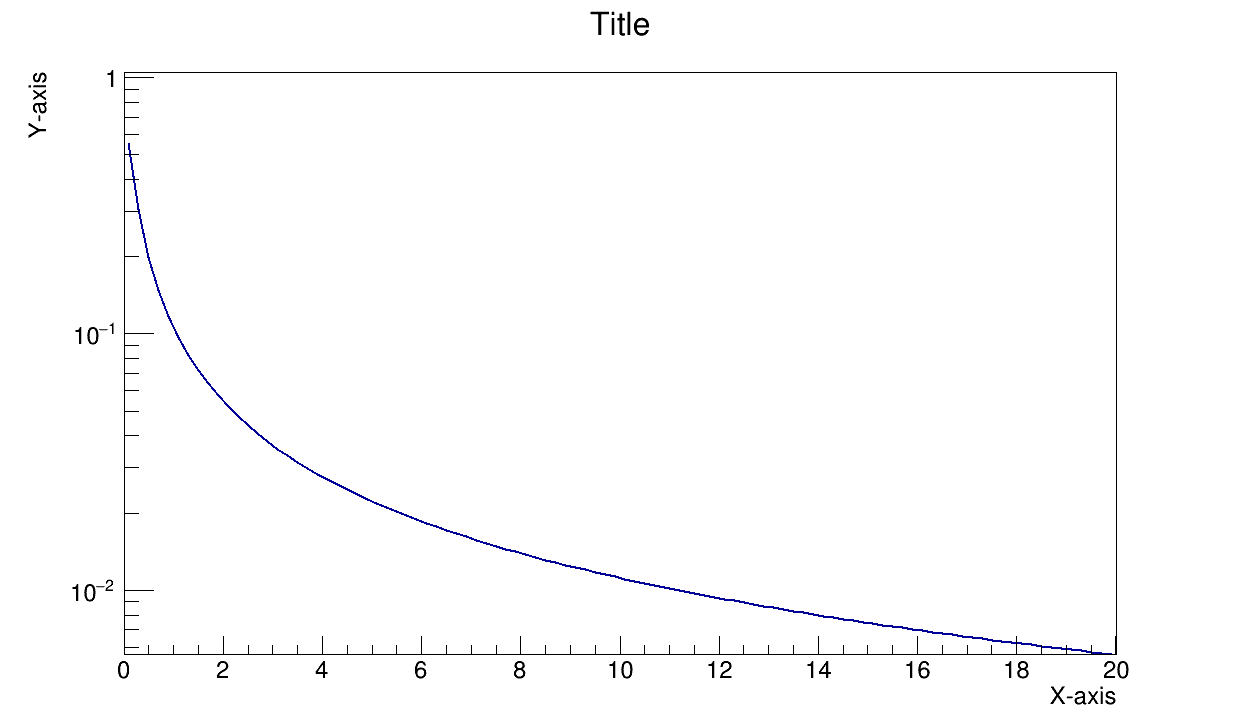
TF1* f1 = new TF1("f1", "1-TMath::Exp((-4.49e-3)*50*(TMath::Sqrt(4*TMath::Sq(x)-TMath::Sq(0.14)))/(4*TMath::Sq(x)))", 0, 20);
f1->SetParameter(0, L);
f1->SetLineColor(kBlue+2);
gPad->SetLogy();
f1->SetTitle("Title; X-axis; Y-axis");
f1->Draw();
How can I change this plot into signal-to-noise enhancement plot?
Thank you.