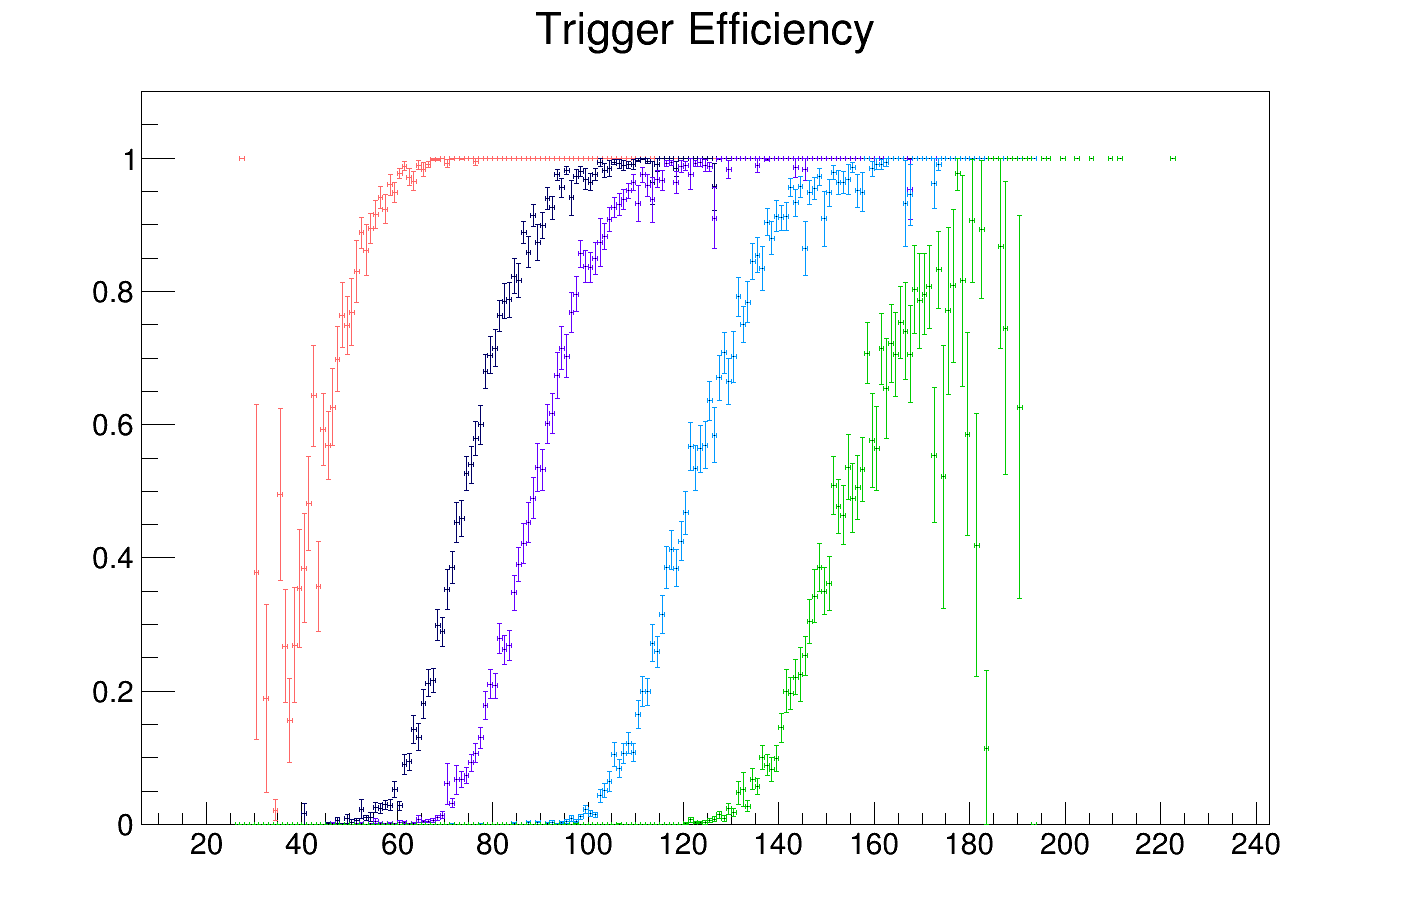
Hi all! I have plotted efficiency curves, and now I want to fit sigmoid functions to them. I tried to fit a sigmoid function to the first efficiency curve (the red one), which is called eff[0].
The problem is that I get a different fit every time I run it (even though, my efficiency curve is the same each run). And shouldn’t I also be able to change my parameter limits slightly without it affecting my fit, because what I do with the parameter limits is that I am basically guessing what value I think the parameter will have, right? And so my parameter output changes each time, but surely, it should just find the best fit each time, which should be the same? Also, my terminal says: STATUS = FAILED and ERROR MATRIX UNCERTAINTY = 100%. What am I doing wrong? Thanks!
In ROOT, before you try to fit your graph or histogram, you MUST set “reasonable” initial values for ALL parameters of your function (except for some “built-in” formulas, like “gaus”, for which the standard fit procedure can automatically “guess” them), otherwise the fitting procedure may easily misbehave.
Search for “Setting initial conditions” in the TGraph::Fit and TH1::Fit methods descriptions.
I tried adding that line, and my fit looks better, but it still says STATUS: FAILED, which means that it couldn’t find a proper fit I guess? And the fit still changes quite a lot depending on which initial values I choose… It’s almost as if, it just draws the sigmoid function using the chosen parameters, but it doesn’t actually fit it to my data.
Already @Wile_E_Coyote answers. It is essential to set parameters as close as possible to the solution. In addition you might need to set parameter limits to avoid regions where the function is ill defined or does not make sense for your data, for example wrong slopes for your sigmoids.
However I see that some of your data contains outliers (see greed data). This could also make the fit more difficult and might require stronger constraints in your parameter
Hi, yes, my plot comes from a histogram. I tried both “W” and “EX0”, and “W” seems to give a nicer fit in general, I am just not sure whether it is justified to just ignore all my errors…
But what is the type of eff[0]. If your data are efficiencies, for a correct error display and fitting you should use the TEfficiency class and TEfficiency::Fit