I defined a sigmoid function with 2 parameters (and set the initial parameter values). I am now trying to fit this function to a plot (called fun[1]), however my ‘fit’ always just takes my initial parameter values, even though that is definitely not the best fit. Most of the time I also get the message saying that STATUS = FAILED, a few times, however, I got STATUS = CONVERGED, but that result clearly wasn’t the best fit.
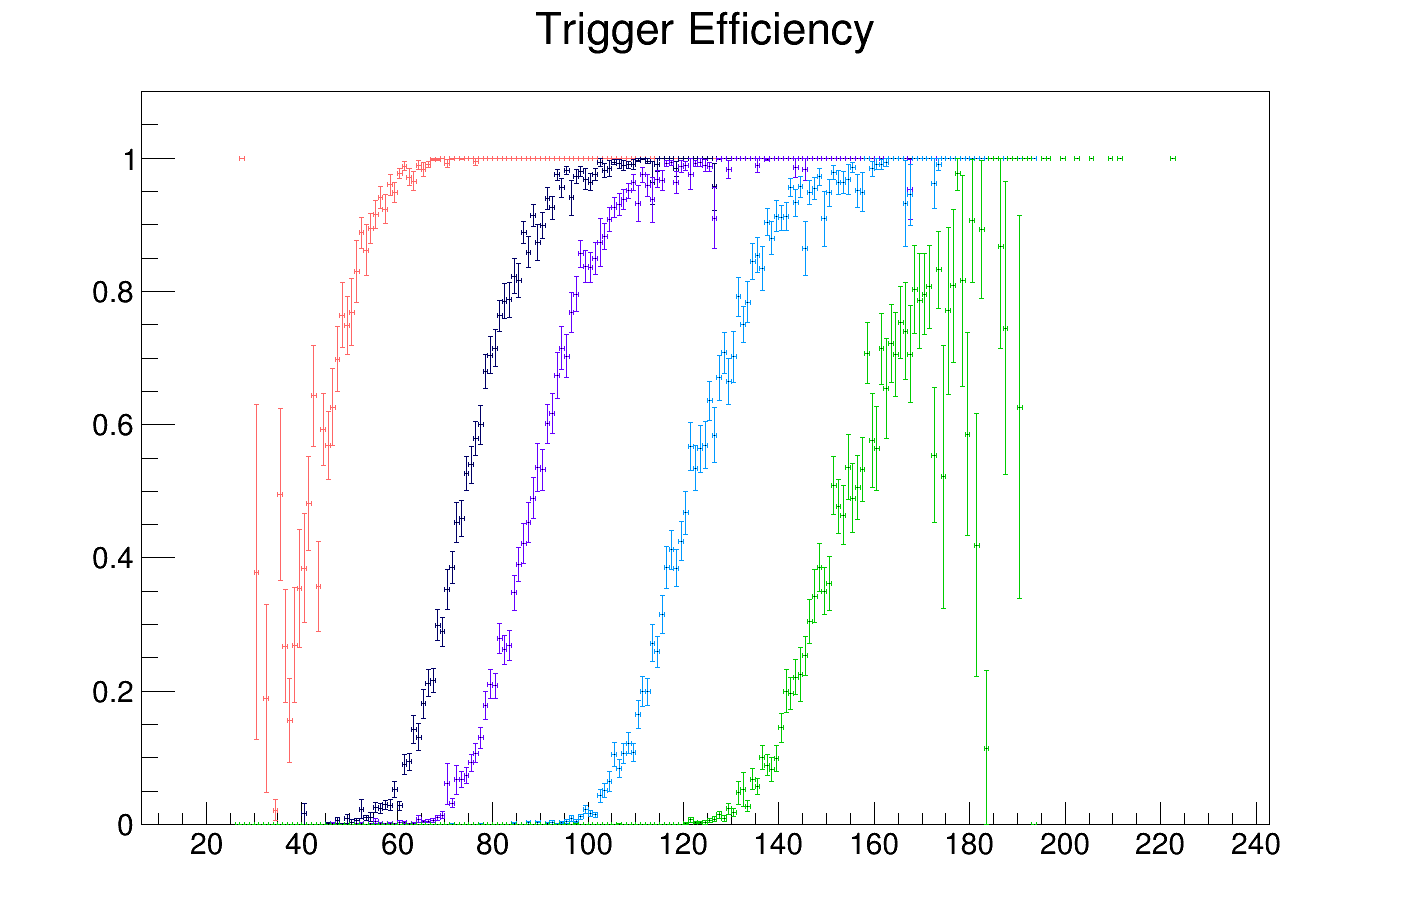
Ah yes of course! fun[1] is the first curve (the red one, I called it eff[0] in my code). It’s the trigger efficiency (found by dividing 2 histograms). I have included my full code below. I hope this helps!
Ah, I’m sorry . I have no access to the data at the moment, but I have attached a root file which (hopefully) contains the histograms. They have different names in the file. Basically, in my code:
k1 is the one that starts with yCut_0.6/pT1_0/pT2_0/…
h[0] starts with L1_J20/…
h[1] starts with L1_J40/…
and so on for h[2], h[3] and h[4], with J50, J75, J100 respectively.
Yes, you’re right. My original root file contained many more irrelevant histograms, so I created a new one with only the relevant ones. I edited my macro in my previous post. It should work now I think.
BTW: You probably meant: fit[i] = new TF1(TString::Format("sigm_%d", i), ...);, but note also that you do not need “separate” functions for each of your graphs.
Thanks a lot! That works! When running my macro, I get a warning saying: “Warning in TGraphAsymErrors::Divide: Number of graph points is different than histogram bins - 9824 points have been skipped skipped”. Do you perhaps know why I get this error and how to fix this? Thanks!
@moneta do you think I should use the TEfficiency::Fit in this case? (my macro and root file are in a previous post). Because I’m not sure how to create a TEfficiency class (I read the documentation on it, but still not sure how to do this in my case)…
Thanks!
Yes you should use TEfficiency::Fit.
To create you need the original histograms, the numerator and the denominator that you used to compute the ratio. If you don’t have it can be problematic
I read the documentation about the TEfficiency class, but I am not sure how to use it. I tried to create my efficiency using the TEfficiency class like this:
void Efficiency(){
  auto f = new TFile ("histossss.root");

  TH1D *k1 = (TH1D*)f->Get("notrigger");

  std::vector<std::string> TriggerCut = {"J20", "J40", "J50", "J75", "J100"};

  int n = TriggerCut.size();

  TH1D *h[n];
  TGraphAsymmErrors *eff[n];
  TF1 *fit[n];
  TEfficiency *eff[n];

  std::vector<int> offset = {50, 75, 90, 125, 160};

  for (unsigned i = 0; i < n; i++) {
    f->GetObject(TString::Format("%s", TriggerCut[i].c_str()) , h[i]);
    if (TEfficiency::CheckConsistency(h[i], k1)) {
       eff[i] = new TEfficiency(h[i], k1)
     }
    eff[i]->SetNameTitle("eff", "Trigger Efficiency");

    if (i == 0) eff[i]->SetLineColor(kRed-7);
    else if (i == 1) eff[i]->SetLineColor(kBlue+3);
    else if (i == 2) eff[i]->SetLineColor(kViolet+7);
    else if (i == 3) eff[i]->SetLineColor(kAzure+7);
    else eff[i]->SetLineColor(kGreen+1);
    if (i==0) eff[i]->Draw("ap");
    else eff[i]->Draw("p same");

    fit[i] = new TF1("sigm_%d", "(1/(1+ TMath::Exp(-[0]*(x-[1]))))", 0, 230);
    fit[i]->SetParNames("stretching", "x-axis");
    fit[i]->SetParameters(0.2, offset[i]);
    eff[i]->Fit("sigm_%d");
  }
}
However, I get a lot of errors: including “error: reference to type ‘cons TH1’ could not bind to an lvalue of type ‘TH1D *’ : if (TEfficiency::CheckConsistency(h[i], k1))” and “error: no matching constructor for initialisation of ‘TEfficiency’: eff[i] = new TEfficiency(h[i], k1)”. Do you know what I am doing wrong? Thanks!
if (TEfficiency::CheckConsistency(*h[i], *k1)) {
       eff[i] = new TEfficiency(*h[i], *k1)
     }
However, I don’t see in your code where you create or get the histogram containing the events that pass the trigger section, the passed histogram, h[i]
Using the fit function I used in my macro, is there any way to only fit my plots for efficiencies that are higher than or equal to 80%? i.e. I’d like to set a range to my fit from 0.8 until 1, is this possible? Thanks!
 . I have no access to the data at the moment, but I have attached a root file which (hopefully) contains the histograms. They have different names in the file. Basically, in my code: