I know this seems to have been asked a lot previously, however I cannot seem to get any of the solutions to work for my use case.
I have two trees, each plotting two branches (with the same names) in a scatter plot and creating a new legend fails to correctly identify the colour of each data set.
f1->Draw("(f.v*3.7):f.t","f.v > 0");
f2->Draw("(f.v*3.7):f.t","f.v > 0","same");
htemp1 *htemp1 = (TH2F*)gROOT->FindObject("htemp");
htemp1->SetTitle("Title;x;y");
TLegend *leg = new TLegend();
leg->AddEntry("f1","R1 points","f");
leg->AddEntry(f2/*I tried combinations of any method I'd seen online*/,"R2 Points","f");
leg->Draw();
Any clues would be massively appreciated.
Thanks,
Alistair
$ root
-------------------------------------------------------------------
| Welcome to ROOT 6.15/01 http://root.cern.ch |
| (c) 1995-2018, The ROOT Team |
| Built for macosx64 |
| From heads/master@v6-13-04-801-g314ee32658, Aug 02 2018, 15:14:56 |
| Try '.help', '.demo', '.license', '.credits', '.quit'/'.q' |
-------------------------------------------------------------------
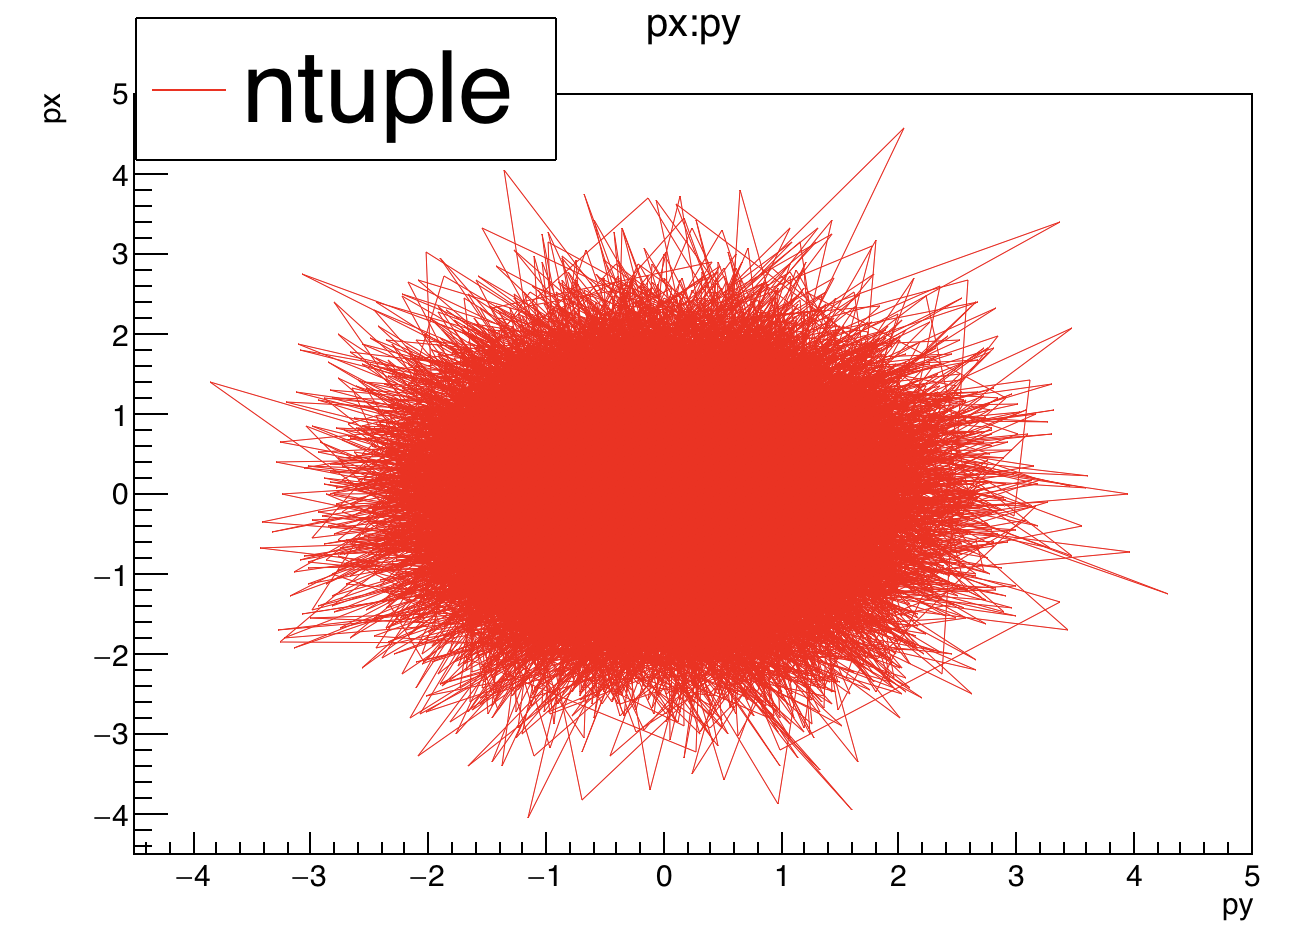
root [0] ntuple->SetLineColor(kRed);
root [1] ntuple->Draw("px:py","","l")
Info in <TCanvas::MakeDefCanvas>: created default TCanvas with name c1
(long long) 25000
root [2] auto L = new TLegend();
root [3] L->AddEntry(ntuple,"ntuple","L");
root [4] L->Draw()
root [5]
Thanks for your suggestions, however I’m afraid neither are working for me; the first runs, but still produces nothing, and the second aborts when f1->Draw(...); is called. Possibly to do with the fact the file is already open?
Could this be an issue with me making multiple plots? Above this code I make a much simpler plot of the same data, but with no cuts in and on a separate canvas, and below I perform calculations using the trees and then make a third plot. Neither of the other plots have a legend, but both run fine.
So if Wile example works for you and if your own example doesn’t, it must be something else in your example. The only way to help you would be you provide a small example not working for you.
Here is my full code for making the two graphs; the trees are made and filled in a different function and then passed over to this function for plotting.
Am I making a rookie error by including two plots in the same function?
double f1avg,f2avg;
f1->SetMarkerColor(kGray+3);
f2->SetMarkerColor(kBlue);

TCanvas *cf = new TCanvas("cf","Raw Data");

f1->Draw("(f.v*3.7):f.t","");
TH2F *htemp = (TH2F*)gROOT->FindObject("htemp");
f1avg = TMath::Mean(f1->GetSelectedRows(),f1->GetV1());
f2->Draw("(f.v*3.7):f.t","","same");
f2avg = TMath::Mean(f2->GetSelectedRows(),f2->GetV1());
htemp->SetTitle(TString::Format("Raw data from sample %s/%s;Time/s;Current/A",name1.c_str(),name2.c_str()));
cf->Update();

TCanvas *c1 = new TCanvas("c1","Plot One");

f1->Draw("(f.v*3.7):f.t",TString::Format("f.v < (%lf*1.75) && f.v > 0",f1avg));
f2->Draw("(f.v*3.7):f.t",TString::Format("f.v < (%lf*1.75) && f.v > 0",f2avg),"same");
TH2F *htemp1 = (TH2F*)gROOT->FindObject("htemp");
htemp1->SetTitle(TString::Format("Plasma data from sample %s/%s;Time/s;Current/A",name1.c_str(),name2.c_str()));
auto leg = new TLegend();

if(f1avg==f2avg){
	cout << "Error automatically detecting R1 and R2 sizes" << endl;
}//(f1=f2_if)

if(f2avg>f1avg){
	cout << "Swapping names for plotting." << endl;
	leg->AddEntry(f2,"R1 Points","f");
	leg->AddEntry(f1,"R2 Points","f");
	set = 1;
}//(f2>f1_if)
if(f1avg>f2avg){
	cout << "Retaining names for plotting." << endl;
	leg->AddEntry(f1,"R1 Points","f");
	leg->AddEntry(f2,"R2 Points","f");
	set = 0;
}//(f1>f2_if)

leg->SetHeader("Legend");
leg->SetTextSize(0.03);
leg->Draw();

c1->Update();
process.root (819 Bytes)
My apologies; the full file is too large to upload, but this is created in the same program using a much shorter data set, hence the scatter graph will look somewhat bare!
I think your macro needs a bit of editing. Now it is:
{
   auto amcfile = new TFile("process.root");
   double f1avg,f2avg;
   f1->SetMarkerColor(kGray+3);
   f2->SetMarkerColor(kBlue);

   TCanvas *cf = new TCanvas("cf","Raw Data");

   f1->Draw("(f.v*3.7):f.t","");
   TH2F *htemp = (TH2F*)gROOT->FindObject("htemp");
   f1avg = TMath::Mean(f1->GetSelectedRows(),f1->GetV1());
   f2->Draw("(f.v*3.7):f.t","","same");
   f2avg = TMath::Mean(f2->GetSelectedRows(),f2->GetV1());
   htemp->SetTitle(TString::Format("Raw data from sample %s/%s;Time/s;Current/A",name1.c_str(),name2.c_str()));
   cf->Update();

   TCanvas *c1 = new TCanvas("c1","Plot One");

   f1->Draw("(f.v*3.7):f.t",TString::Format("f.v < (%lf*1.75) && f.v > 0",f1avg));
   f2->Draw("(f.v*3.7):f.t",TString::Format("f.v < (%lf*1.75) && f.v > 0",f2avg),"same");
   TH2F *htemp1 = (TH2F*)gROOT->FindObject("htemp");
   htemp1->SetTitle(TString::Format("Plasma data from sample %s/%s;Time/s;Current/A",name1.c_str(),name2.c_str()));
   auto leg = new TLegend();

   if(f1avg==f2avg){
      cout << "Error automatically detecting R1 and R2 sizes" << endl;
   }//(f1=f2_if)

   if(f2avg>f1avg){
      cout << "Swapping names for plotting." << endl;
      leg->AddEntry(f2,"R1 Points","f");
      leg->AddEntry(f1,"R2 Points","f");
      set = 1;
   }//(f2>f1_if)
   if(f1avg>f2avg){
      cout << "Retaining names for plotting." << endl;
      leg->AddEntry(f1,"R1 Points","f");
      leg->AddEntry(f2,"R2 Points","f");
      set = 0;
   }//(f1>f2_if)

   leg->SetHeader("Legend");
   leg->SetTextSize(0.03);
   leg->Draw();

   c1->Update();
}
but when I run it it gives:
Processing amc.C...
/Users/couet/Downloads/./amc.C:34:7: error: C++ requires a type specifier for all declarations
      set = 1;
      ^
/Users/couet/Downloads/./amc.C:38:21: error: use of undeclared identifier 'f1'
      leg->AddEntry(f1,"R1 Points","f");
                    ^
/Users/couet/Downloads/./amc.C:39:21: error: use of undeclared identifier 'f2'
      leg->AddEntry(f2,"R2 Points","f");
                    ^
/Users/couet/Downloads/./amc.C:40:7: error: C++ requires a type specifier for all declarations
      set = 0;
      ^
Assertion failed: (isSingleDecl() && "Isn't a single decl"), function getSingleDecl, file /Users/couet/git/roottrunk/interpreter/llvm/src/tools/clang/include/clang/AST/DeclGroup.h, line 87.
I’ve converted the macro into a named macro and tried to load the trees from the file, but it still produces the error below.
#include "TROOT.h"
#include <iostream>
#include <fstream>
#include <string>
#include <numeric>
#include <iterator>
#include <vector>
#include <TH1F.h>
#include <TH2F.h>
#include "TCanvas.h"
#include "TMath.h"
#include "TFile.h"
#include "TTree.h"
#include "TBranch.h"
#include "TSystem.h"
#include "TGraph.h"
#include "ROOT/TDataFrame.hxx"

using namespace std;
using namespace ROOT::Experimental;

class file {

public:
 Double_t t;
 Double_t v;
};

class Event: public TObject {

public:
  file f;
  ClassDef(Event,1)
};

ClassImp(Event)


void forumtest(){
   auto *amcfile = new TFile("process.root");
   TTree *f1;
   amcfile->GetObject("ntuple",f1);
   TTree *f2;
   amcfile->GetObject("ntuple",f2);
   int set;
   double f1avg,f2avg;
	string name1 = "Test";
	string name2 = "Test2";
   f1->SetMarkerColor(kGray+3);
   f2->SetMarkerColor(kBlue);

   TCanvas *cf = new TCanvas("cf","Raw Data");

   f1->Draw("(f.v*3.7):f.t","");
   TH2F *htemp = (TH2F*)gROOT->FindObject("htemp");
   f1avg = TMath::Mean(f1->GetSelectedRows(),f1->GetV1());
   f2->Draw("(f.v*3.7):f.t","","same");
   f2avg = TMath::Mean(f2->GetSelectedRows(),f2->GetV1());
   htemp->SetTitle(TString::Format("Raw data from sample %s/%s;Time/s;Current/A",name1.c_str(),name2.c_str()));
   cf->Update();

   TCanvas *c1 = new TCanvas("c1","Plot One");

   f1->Draw("(f.v*3.7):f.t",TString::Format("f.v < (%lf*1.75) && f.v > 0",f1avg));
   f2->Draw("(f.v*3.7):f.t",TString::Format("f.v < (%lf*1.75) && f.v > 0",f2avg),"same");
   TH2F *htemp1 = (TH2F*)gROOT->FindObject("htemp");
   htemp1->SetTitle(TString::Format("Plasma data from sample %s/%s;Time/s;Current/A",name1.c_str(),name2.c_str()));
   auto leg = new TLegend();

   if(f1avg==f2avg){
      cout << "Error automatically detecting R1 and R2 sizes" << endl;
   }//(f1=f2_if)

   if(f2avg>f1avg){
      cout << "Swapping names for plotting." << endl;
      leg->AddEntry(f2,"R1 Points","f");
      leg->AddEntry(f1,"R2 Points","f");
      set = 1;
   }//(f2>f1_if)
   if(f1avg>f2avg){
      cout << "Retaining names for plotting." << endl;
      leg->AddEntry(f1,"R1 Points","f");
      leg->AddEntry(f2,"R2 Points","f");
      set = 0;
   }//(f1>f2_if)

   leg->SetHeader("Legend");
   leg->SetTextSize(0.03);
   leg->Draw();

   c1->Update();
}
Error:
In file included from input_line_20:1:
/[filepath]/forumtest.C:49:4: warning: invalid memory pointer passed to a callee:
   f1->SetMarkerColor(kGray+3);
   ^~
Ah, I’m guessing that in my full macro where the process.root file is recreated on every run, the fact that the trees are used beforehand to be filled means that they can then be used for plotting without necessarily being written to file correctly in that case?
Would it be possible to transfer the four branches used in the plots to a new tree with a neater structure; I no longer have need of the event class once the data has been inputted, so I could move to File->Tree->Branch, as opposed to File->Tree->Branch->Sub-branch->Leaf
I looked at trying to do that earlier in the macro, but was not sure on how to proceed.