Here is the code. I didn’t make it a file, I just copy and paste this into pyroot CLI.
from ROOT import *
import sys
sys.path.append("modules/")
import math
print 'Number of arguments:', len(sys.argv), 'arguments.'
print 'Argument List:', str(sys.argv)
print 'Use as: script.py -b 0 (or 1,2)'
myinput="interactive"
xdir=""
cross=0
expected_pb=1000.
if (len(sys.argv) ==2):
myinput = sys.argv[1]
print 'Mode=',myinput
gROOT.Reset()
figdir="figs/"
nameX="m_{jjl} [TeV]"
nameY="Events / TeV"
Ymin=0.9
Ymax=1000000000-100000
YRMIN=-4.999
YRMAX=4.999
Xmin=400
Xmax=10000
Xmin=Xmin*0.001
Xmax=Xmax*0.001
NN=0
gROOT.SetStyle("Plain");
c1=TCanvas("c","BPRE",10,10,600,600);
c1.Divide(1,1,0.005,0.005);
c1.SetTickx()
c1.SetTicky()
c1.SetTitle("")
c1.SetLineWidth(3)
c1.SetBottomMargin(0.1)
c1.SetTopMargin(0.05)
c1.SetRightMargin(0.01)
c1.SetFillColor(0)
pad1 = TPad("pad1","pad1",0,0.3,1,0.97)
pad1.SetBottomMargin(0)
pad1.SetLeftMargin(0.13)
pad1.SetRightMargin(0.04)
pad1.SetTopMargin(0.02)
pad1.Draw()
pad1.cd()
pad1.SetLogy(1)
pad1.SetLogx(1)
h=pad1.DrawFrame(Xmin,Ymin,Xmax,Ymax)
ay=h.GetYaxis();
ay.SetLabelFont(42)
ay.SetLabelSize(0.05)
ay.SetTitleSize(0.06)
ay.SetNdivisions(505);
ay.SetTitle(nameY)
ax=h.GetXaxis();
ax.SetTitle(nameX);
ax.SetTitleOffset(1.18)
ay.SetTitleOffset(0.8)
ax.SetLabelFont(42)
ay.SetLabelFont(42)
ax.SetLabelSize(0.12)
ax.SetTitleSize(0.14)
ax.Draw("same");
ay.Draw("same");
dir=xdir
ff=TFile("../analysis/out/sys42/data/data_2015_2016_2017_2018.root")
ff.ls()
name="jjlmass_tev"
hh=ff.Get(name)
hhorg=hh.Clone()
TFdata=[]
TFdata2015=[]
TFdata2016=[]
TFdata2017=[]
TFdata2018=[]
TFttbar=[]
TFwjet=[]
TFstop=[]
QCDsamples=[1,2,3,4,5,6,7]
MCqcd_list=[]
maindir='../analysis/out/'
for i in range (0,1):
sdir=maindir+'sys'+str(i)+"/data/"
TFdata.append( TFile(sdir+"data_2015_2016_2017_2018.root") )
systematics=0
fdata=TFdata[systematics]
bins=fdata.Get("bins_m_tev")
m1=bins.GetBinContent(1)
nCPU=int(m1/(13.0*0.001))
print "Nr of cores=",nCPU
bins.Scale(1.0/nCPU)
hh.Divide(bins)
Events=hh.GetBinContent(1)
hh.SetTitle("")
hh.SetStats(0)
hh.SetLineWidth(2)
hh.Print("All")
hh.SetAxisRange(Ymin,Ymax,"y");
hh.SetAxisRange(Xmin,Xmax,"x");
hh.SetMarkerColor( 1 )
hh.SetMarkerStyle( 20 )
hh.SetMarkerSize( 0.8 )
#print hh.Integral(hh.FindFixBin(1.0),hh.FindFixBin(2.0))
#print 5*math.sqrt(hh.Integral(hh.FindFixBin(1.0),hh.FindFixBin(2.0)))
print hh.Integral(hh.FindFixBin(5.0),hh.FindFixBin(6.0))
print 5*math.sqrt(hh.Integral(hh.FindFixBin(5.0),hh.FindFixBin(6.0)))
#Signal Injection
class Gauss:
def __call__( self, x, par ):
out=par[0] * TMath.Gaus(x[0],par[1],par[2])
return out;
a=0.1
b=5.5
c=0.2
pycaller = Gauss()
bla=TF1("bla",pycaller,5.0,6.0,3);
bla.SetParameters(a,b,c)
bla.SetParNames("a","b","c")
for i in range(0,287):
TFdata.append(hh.Fill(bla.GetRandom(5.0,6.0)))
#End of Signal Injection
hh.Draw("pe")
MyMinX=Xmin
MyMaxX=Xmax
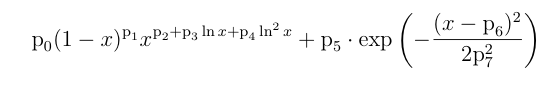
class FiveParam2015TEV_plus_Gauss:
def __call__( self, x, har ):
Ecm=13.;
fCenterOfMassEnergy = Ecm;
fUseWindowExclusion = False;
x = x[0] / fCenterOfMassEnergy;
ff1=har[0]*TMath.Power((1.0-x),har[1])
ff2=TMath.Power(x,(har[2]+har[3]*math.log(x)+har[4]*math.log(x)*math.log(x)))
ff3=har[5]*TMath.Gaus(x,har[6],har[7])
ff=((ff1*ff2)+ff3);
return ff;
pycall= FiveParam2015TEV_plus_Gauss()
ball=TF1("ball",pycall,MyMinX,MyMaxX,8);
ball.SetNpx(200); ball.SetLineColor(3); ball.SetLineStyle(1)
ball.SetLineWidth(2)
ball.SetParameter(0,1.77279e+06)#ball.SetParameter(0,20.12911e-01)
ball.SetParameter(1,15.4542)#ball.SetParameter(1,1.33731e+01)
ball.SetParameter(2,5.16633)#ball.SetParameter(2,-1.87060e-01)
ball.SetParameter(3,3.13384)#ball.SetParameter(3,8.84446e-01)
ball.SetParameter(4,0.427836)#ball.SetParameter(4,1.21341e-01)
#ball.SetParameter(0,2.01569e+06)#ball.SetParameter(0,20.12911e-01)
#ball.SetParameter(1,15.587)#ball.SetParameter(1,1.33731e+01)
#ball.SetParameter(2,5.26436)#ball.SetParameter(2,-1.87060e-01)
#ball.SetParameter(3,3.16089)#ball.SetParameter(3,8.84446e-01)
#ball.SetParameter(4,0.430464)#ball.SetParameter(4,1.21341e-01)
ball.SetParameter(5,0.1)
ball.SetParLimits(5,0,10)
ball.SetParameter(6,5.5)
ball.SetParLimits(6,5.4,5.6)
ball.SetParameter(7,0.2)
ball.SetParLimits(7,0,1000000000)
import random
nn=0
chi2min=10000
parbest=[]
fithr=hh.Fit(ball,"SMR0")
fithr.Print()
print "Histogram Normalization=", hh.Integral()
print "Originial Histogram Normalization=", hhorg.Integral()
har = ball.GetParameters()
ball.Draw("same")
chi2= ball.GetChisquare()
ndf=ball.GetNDF()
print "Chi2=", chi2," ndf=",ndf, " chi2/ndf=",chi2/ndf
l=TLatex()
l.SetTextSize(0.04)
l.SetNDC();
l.SetTextColor(1);
l.DrawLatex(0.3,0.4,"pp #sqrt{s}=13 TeV")
l=TLatex()
l.SetTextSize(0.04)
l.SetNDC();
l.SetTextColor(1);
l.DrawLatex(0.65,0.61,"ATLAS")
leg2=TLegend(0.6, 0.73, 0.89, 0.90);
leg2.SetBorderSize(0);
leg2.SetTextFont(62);
leg2.SetFillColor(10);
leg2.SetTextSize(0.04);
leg2.AddEntry(hh,"Data","pl")
#leg2.AddEntry(back,"Fit ("+str(back.GetNpar())+" par)"+" m_{jjl}>"+str(MyMinX)+" TeV","l")
leg2.AddEntry(ball,"Signal+Background Fit ("+str(ball.GetNpar())+" par)"+" m_{jjl}>"+str(MyMinX)+" TeV","l")
leg2.AddEntry(ball,"#chi^{2}/ndf="+"{0:.2f}".format(chi2/ndf),"")
#leg2.AddEntry(back,"#chi^{2}/ndf="+"{0:.2f}".format(chi2/ndf),"")
leg2.Draw("same");
l=TLatex()
l.SetNDC()
l.SetTextFont(72)
l.SetTextSize(0.05)
l.DrawLatex(0.19,0.89,"ATLAS")
p=TLatex()
p.SetNDC();
p.SetTextSize(0.04)
p.SetTextFont(42)
l=TLatex()
l.SetTextSize(0.05);
l.SetNDC();
l.SetTextColor(4);
l.DrawLatex(0.75,0.46,"LE-CR 2+1");
ax=hh.GetXaxis();
ax.SetTitleOffset(0.8)
ax.SetTitle( nameX );
ay=hh.GetYaxis();
ay.SetTitleOffset(0.8)
ay.SetTitle( nameY );
ax.SetTitleOffset(1.1);
ay.SetTitleOffset(1.4)
ax.Draw("same")
ay.Draw("same")
events=hh.Integral()
print events
c1.Update()
c1.cd()
pad2 = TPad("pad2","pad2",0,0.01,1,0.3)
pad2.SetLeftMargin(0.13)
pad2.SetRightMargin(0.04)
pad2.SetTopMargin(0)
pad2.SetBottomMargin(0.31)
pad2.Draw()
pad2.cd()
h=pad2.DrawFrame(Xmin,YRMIN,Xmax,YRMAX);
ay=h.GetYaxis();
ay.SetLabelFont(42)
ay.SetLabelSize(0.10)
ay.SetTitleSize(0.3)
ay.SetNdivisions(505);
ax=h.GetXaxis();
ax.SetTitle( nameX );
ax.SetTitleOffset(1.18)
ay.SetTitleOffset(0.8)
ax.SetLabelFont(42)
ay.SetLabelFont(42)
ax.SetLabelSize(0.12)
ax.SetTitleSize(0.14)
ay.SetLabelSize(0.12)
ay.SetTitleSize(0.2)
ax.Draw("same");
ay.Draw("same");
hb=h
hb.GetXaxis().SetTickLength(0.05)
hb.GetXaxis().SetNdivisions(20,5,1, True);
hb.GetXaxis().SetMoreLogLabels(True)
DiffBG=TGraphErrors()
DiffBG.SetMarkerColor(2)
DiffBG.SetMarkerStyle( 20 )
DiffBG.SetMarkerSize( 0.7 )
Sig=bins.Clone();
Sig.SetFillColor(2);
res=TH1D("Res","Res",100,-10,10);
n=0;
for i in range(1,hh.GetNbinsX()):
Sig.SetBinContent(i,0)
Sig.SetBinError(i,0)
if (hh.GetBinCenter(i)>MyMinX and hh.GetBinCenter(i)<MyMaxX and hh.GetBinContent(i)>0):
center=hh.GetBinCenter(i)
x=hh.GetBinCenter(i)
D = hh.GetBinContent(i);
Derr = hh.GetBinError(i);
B = ball.Eval(center);
Berr = math.sqrt(B);
frac=0
fracErr = 0.;
if B != 0:
frac = (D-B)/Derr
res.Fill(frac)
Sig.SetBinContent(i,frac)
Sig.SetBinError(i,fracErr)
DiffBG.SetPoint(n,x,frac)
n=n+1
out="root/2015_2017_fit_5p_res.root"
x1=c1.XtoPad(Xmin)
x2=c1.XtoPad(Xmax)
ar5=TLine(x1,0,x2,0);
ar5.SetLineWidth(2)
ar5.SetLineStyle(2)
ar5.Draw("same")
l1=TLatex()
l1.SetTextAngle(90)
l1.SetTextSize(0.10);
l1.SetNDC();
l1.SetTextColor(1);
l1.DrawLatex(0.06,0.4,"D_{i} - F_{i} / #Delta D_{i}");
Sig.Draw("same histo ][")
pad2.SetLogx(1)
hh.Integral(hh.FindFixBin(5.0),hh.FindFixBin(6.0)) # 455.3967853861547 with signal injection, 168.39678538615473 without signal injection
5*math.sqrt(hh.Integral(hh.FindFixBin(5.0),hh.FindFixBin(6.0))) #106.70013886895306 with signal injection, 64.88389349178938 without signal injection
print hh.FindFixBin(5.0)
print hh.FindFixBin(6.0)
print hh.Integral(29,46)
5*math.sqrt(hh.Integral(115,124))
pad1.cd()