Hi @moneta , thank you for the response but I think I might have been unclear as what I want makes sense and is what someone manually setting the axis range that has explicitly chosen to use co-ordinate values rather than bin numbers would want (and is also what the documentation for SetRangeUser claims it does “Set the viewing range for the axis from ufirst to ulast (in user coordinates).”, not set the viewing range for the axis to the lower bin edge below ufirst and the upper bin edge above ulast).
I’ve added some images below to demonstrate.
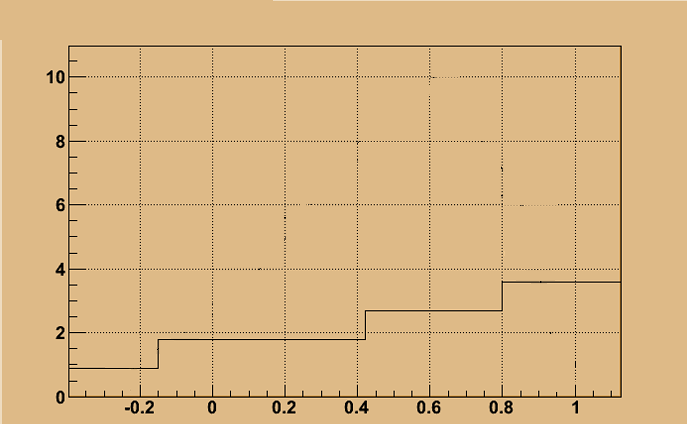
Firstly what one would get if they did hist->GetXaxis()->SetRangeUser(-0.4,0.9)
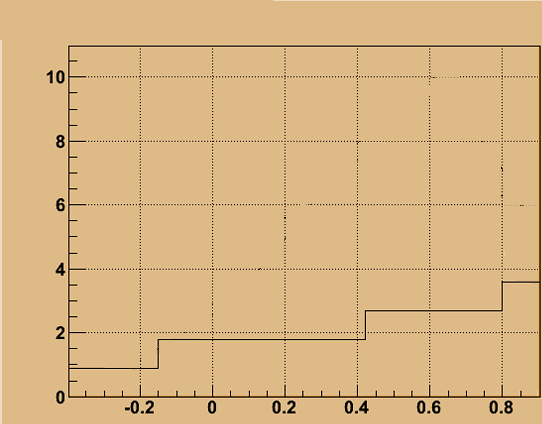
However what I would like would be for ROOT to set the axis range to values I explicitly set it to, of -0.4 to 0.9. i.e. the image shown below:
Hi @Wile_E_Coyote, what I’m trying to draw is a TH1, the image is just an example I found to show what I would want to do. i.e. ignore the graph part of it, just the histogram part.
I’ve edited out the graph part of the image to make it more clear what I mean.
Maybe @couet can comment also on the viewing range.
For me it does not make sense for an histogram. You can always redefine a smaller binning if you need
Hi @Wile_E_Coyote, perfect! Thank you this does exactly what I needed.
Is it possible however to add a function that does something like this to ROOT? It shouldn’t be necessary to have to do a workaround like this just to set the axis range to exactly where you want. As well as this, the documentation for setRangeUser ( https://root.cern.ch/doc/master/classTAxis.html#ac85f8261dedc23bbe68f90afd196cdb8 ) should be updated to make it clear that this sets it to the bin edge below ufirst and above ulast, unlike what the documentation currently claims.