Hi all,
I`m making TMultiGraph with 3 graphs in pyroot.
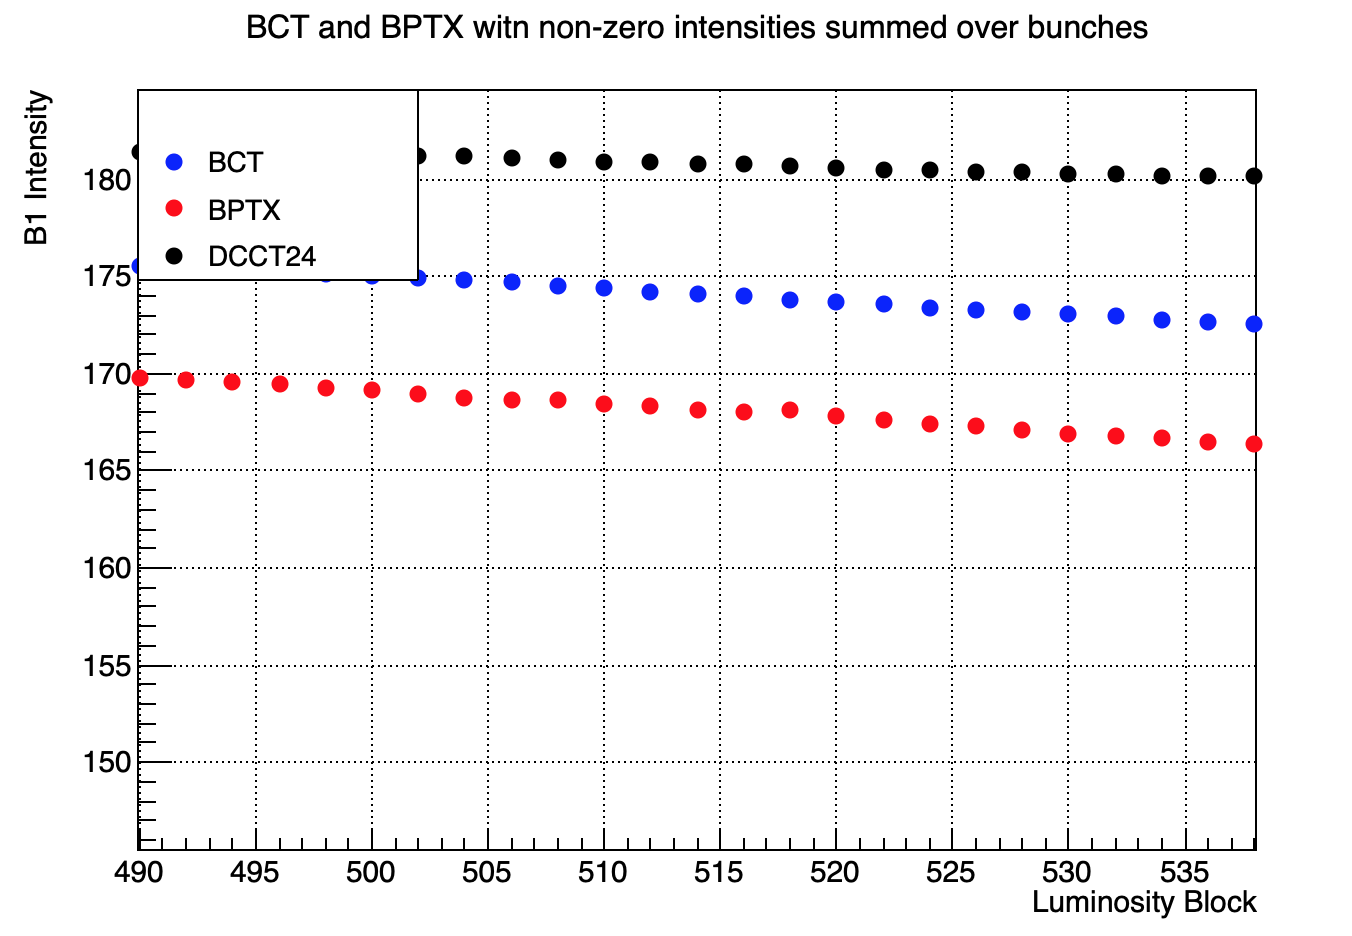
I need it to be with limits on the x-axis (490,538), so I add
g.GetXaxis().SetRangeUser(490,538)
and when draw it, one point (let`s call it a) that is a<490 is shown on canvas also (see attached pic)
How can I make it stop showing that point a?
Thanks in advance,
V.
couet
March 4, 2020, 3:28pm
2
Can you provide a macro reproducing your problem ?
Here is the macro …
I had to paste arrays manualy since I`m getting them from some calculations from ntuple,
thats why code looks like little messymacro123.py (10.9 KB)
Thanks a lot couet…
You saved me.
All the best,
V.
1 Like
system
Closed
March 18, 2020, 5:17pm
6
This topic was automatically closed 14 days after the last reply. New replies are no longer allowed.