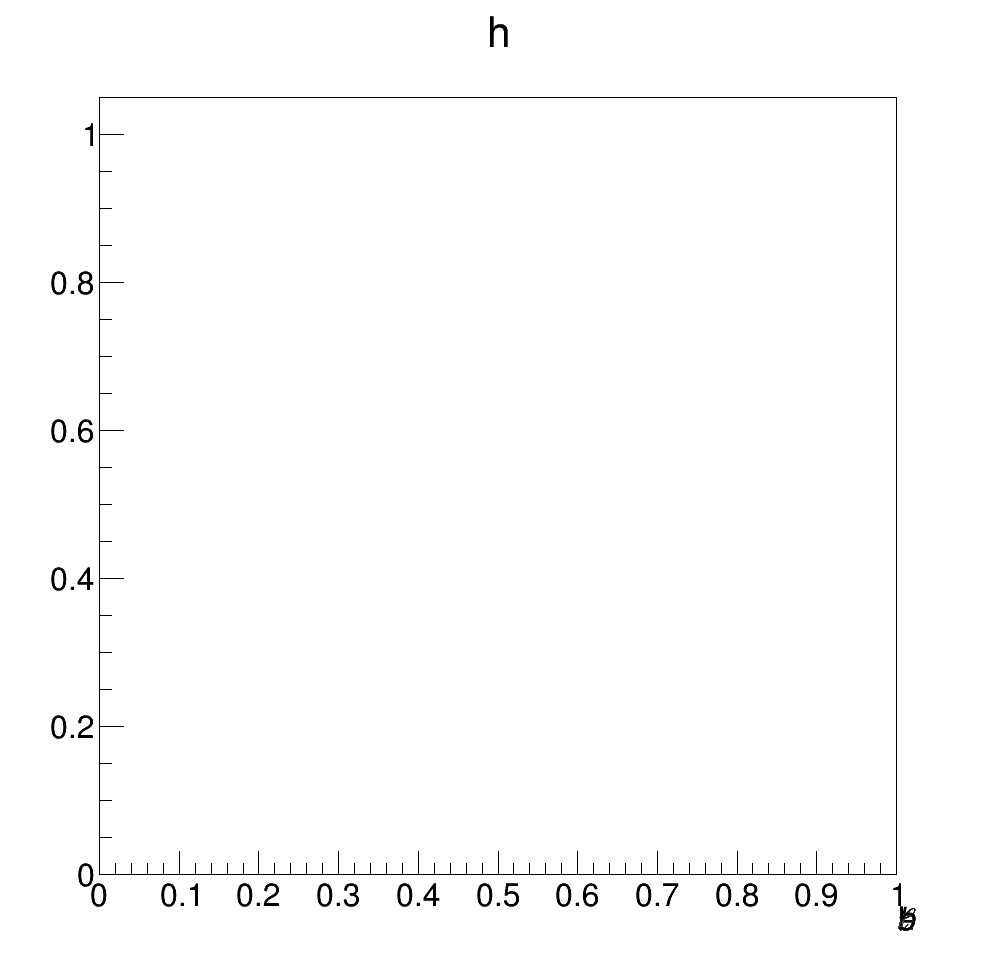
In the course of trying to make a plot with a lowercase script L in the x-axis title, I discovered that something about using SetOptStat(0) breaks this. If I run the following as a macro, the resulting plot has all the letters in the axis title placed in the same spot in the bottom right corner of the canvas, in an unreadable jumble.
gStyle.SetOptStat(0);
TH1F h = TH1F("h","h",1,0.,1.);
TCanvas c = TCanvas("c","c",1000,1000);
h.GetXaxis().SetTitle("he \\ell\\ell o}");
h.Draw();
c.Print("broken_title.png");
Using ROOT 5.34/30, this happens when I run that code as a macro, but not if I do the same thing interactively. It also happens in pyROOT and rootpy using Python 2.7.9, though not if I use IPython. I wasn’t able to recreate it in ROOT 5.34/20. An example image is attached.
[Edited to add: this only happens with the first image drawn; other plots made with the same script are fine.]
Is this a known issue, or fixed in newer versions?
Thanks!