Hi,
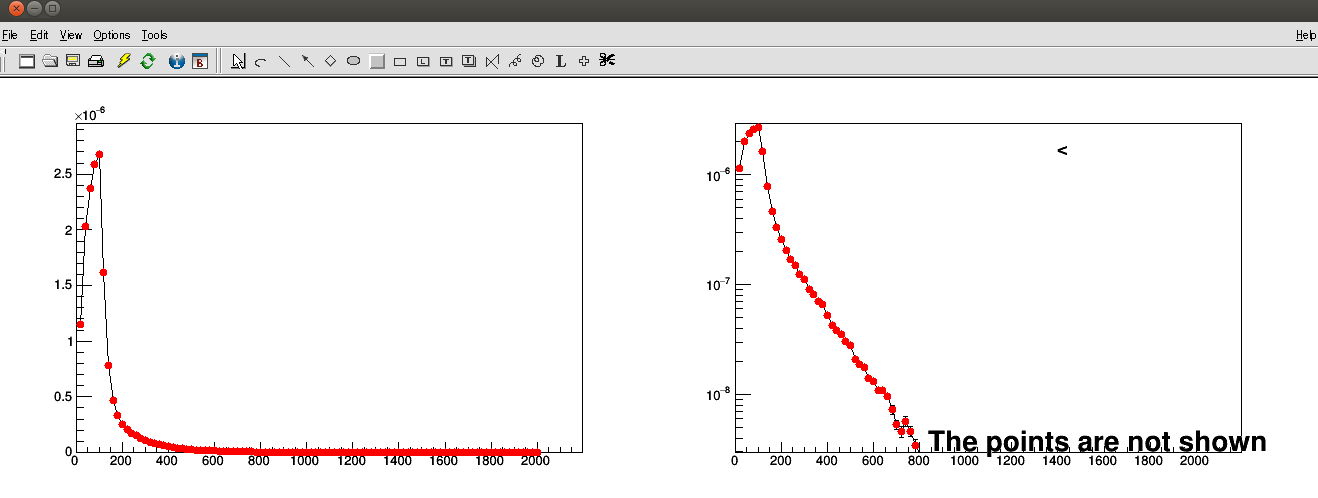
I have a TGraphErrors graph. Values of the points on the graph are very small, 1e-12 to 1e-5. When I set
gPad->SetLogy()
only the part with large values are shown. I attach a snapshot and its root file here.
I suspect SetLogy() has a range requirement… Any hint?
Thanks.
test.root (5.59 KB)
gsize
2
try to use graph->SetMinimum(1.e-13);
It doesn’t work to me. I am trying to understand why the y axis range cannot be automatically and properly set …
gsize
4
the Y data is 0 in some points.
it will be some trouble when use SetLogy.
{
  gROOT->Reset();
  TFile f = TFile("test.root");
  TCanvas* c1 = new TCanvas("c1", "  ");
  TGraphErrors* hist1 = (TGraphErrors*)f.Get("gTally14");
  hist1->Draw("ap");
hist1->SetMinimum(1.e-25);
  c1->SetLogy(1);

  hist1->Print();
}
couet
5
{
  TFile *f = new TFile("test.root");
  TCanvas* c1 = new TCanvas("c1", "  ");
  TGraphErrors* hist1 = (TGraphErrors*)f->Get("gTally14");
  hist1->Draw("ap");
  hist1->SetMinimum(1E-12);
  c1->SetLogy(1);
}
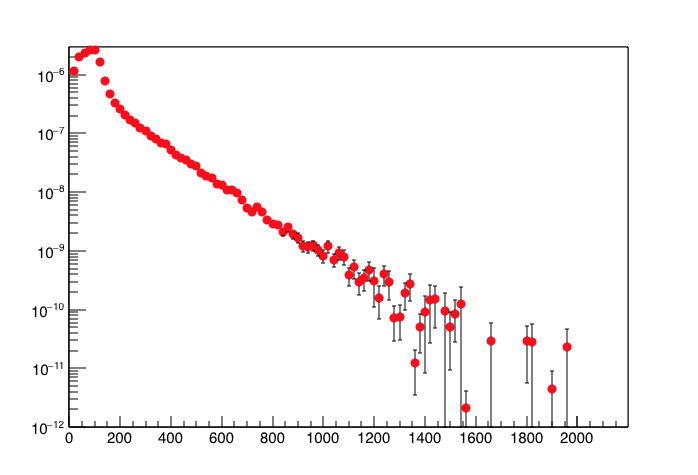
Gives me: