Hey,
I have a regular TH2D filled with some data and draw it in 2D mode (“COLZ”).
When applying
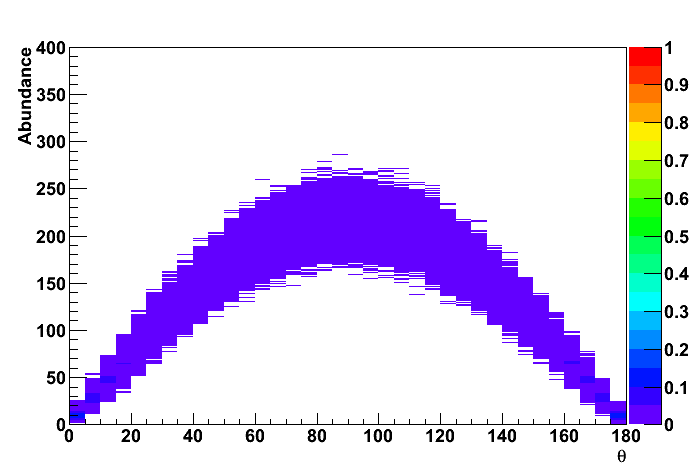
canvas->SetLogz(1);
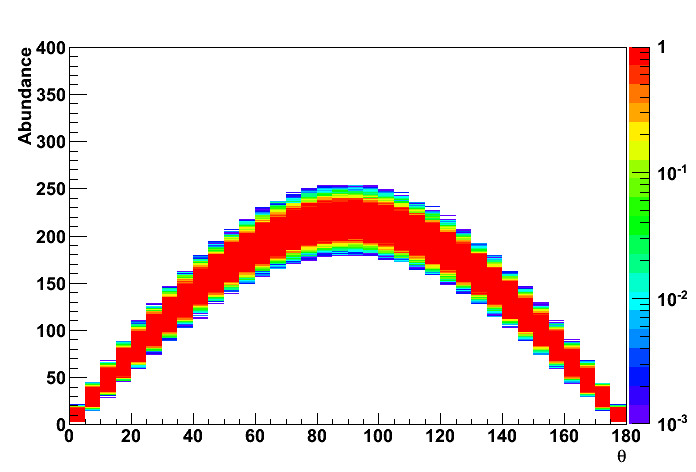
the color-coding gets complet wrong compared to the histogram with normal color-coded Z-Axis.
One additional information: the integral over all y-bins for constant x bin is 1 per construction.
I attach two example plots, one with SetLogz(0) and one with SetLogz(1).
I’m running root 5.28.00 on MacOS 10.5.8.
I have also tested the code on a linux machine with root 5.26.00, there this error is not present.
So is this a bug in the new version or is my code?
Thanks,
Stephan