SetLineColor() doens't work for TH2F in pyroot

Hello,

just a simple question. I would like to superimpose two histos.
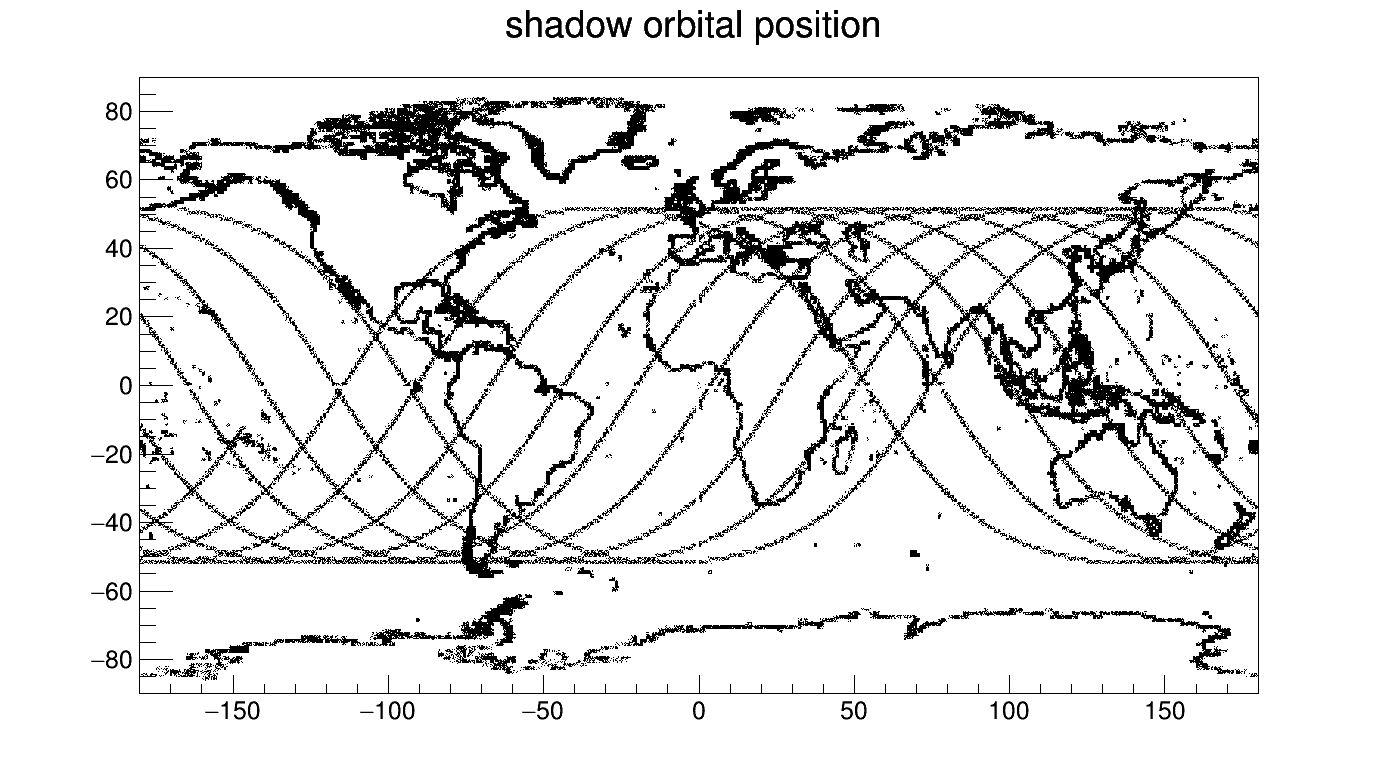
Actually it is a simple plot showing the wordl map with a satellite orbits. Anyway, the second
histogram should have a different line color but SetLineColor(ROOT.kRed) seems not working.
The code is below:

cart = "/user/root-6.22.02/tutorials/graphics/world.dat"

def world_map(cart):
	with open(cart) as f:
		for line in f:
			line = line.strip()
			if not line:  # line is blank
				continue
			else:
				vals = line.split()
				#print vals[0], vals[1]				
				world_lat.append(float(vals[0]))
				world_lon.append(float(vals[1]))

h_map = TH2F('histo', 'Mini-EUSO shadow orbital position ',360,-180,180,180,-90,90)
for j in range(len(world_lat)):
	h_map.Fill(world_lat[j],world_lon[j])
#gStyle.SetOptStat(0)

h_map.Draw("")
h_map.SetDirectory(0)

c1.Update()

histo = TH2F('histo', 'Mini-EUSO shadow orbital position ',360,-180,180,180,-90,90)
for k in range(len(lat)):
	histo.Fill(lon[k],lat[k])
histo.GetXaxis().SetTitle("lon [degrees]")
histo.GetYaxis().SetTitle("lat [degrees]")
histo.SetLineColor(ROOT.kRed) #SetLineColor(2)
#gStyle.SetOptStat(0)
histo.Draw("same")
"""
gr = TGraph(len(lat), lon, lat)
c1.cd()
gr.SetMarkerStyle(105)
gr.SetMarkerColor(2)
gr.GetXaxis().SetTitle("lon [degrees]")
gr.GetYaxis().SetTitle("lat [degrees]")
gr.Draw("same")
"""

c1.SaveAs(dir1+"orbital_path_2.png")

all x,y variables are numpy array of floats.
As you could see I tried also making a TGraph() instaed of an histogram but nothing change!
Any advice? And moreover, could you explain why it doesn’t work!
For sure if you have another way which is easier and powerfull I will
listen at it!

Many may thanks in advance


ROOT Version: Not Provided
Platform: Not Provided
Compiler: Not Provided


Hello,

I think this is not Python-specific, so asking for the help of @couet

I do not have you data so I tried to reproduce the issue. I made the following example:

void h1same()
{
   TH1F *h1 = new TH1F("h1","h1",100,-4,4);
   TH1F *h2 = new TH1F("h2","h1",100,-4,4);
   Double_t px,py;
   for (Int_t i = 0; i < 25000; i++) {
      gRandom->Rannor(px,py);
      h1->Fill(px);
      h2->Fill(py);
   }
   h1->SetLineColor(kRed);
   h2->SetLineColor(kGreen);
   h1->Draw();
   h2->Draw("SAME");
}

It works for me:

histo.Draw("same")

your histo is 2D, which doesn’t have a line in the same sense of 1D histos.
Check out the options for 2D in the reference. Maybe you want to draw it with the “box” option, or “cont”? depends on what you want to draw (see the examples scrolling down that page).

Ah yes, sorry, your histogram is 2D. here is an example:

void boxsame() {
   auto c = new TCanvas("c","Example of BOX plots with option SAME",200,10,700,500);
   TH2F *h1 = new TH2F("h1","h1",40,-3,3,40,-3,3);
   TH2F *h2 = new TH2F("h2","h2",40,-3,3,40,-3,3);
   TH2F *h3 = new TH2F("h3","h3",40,-3,3,40,-3,3);
   TH2F *h4 = new TH2F("h4","h4",40,-3,3,40,-3,3);
   for (Int_t i=0;i<1000;i++) {
      double x,y;
      gRandom->Rannor(x,y);
      if(x>0 && y>0) h1->Fill(x,y,4);
      if(x<0 && y<0) h2->Fill(x,y,3);
      if(x>0 && y<0) h3->Fill(x,y,2);
      if(x<0 && y>0) h4->Fill(x,y,1);
   }
   h1->SetLineColor(1);
   h2->SetLineColor(2);
   h3->SetLineColor(3);
   h4->SetLineColor(4);
   h1->Draw("box");
   h2->Draw("box same");
   h3->Draw("box same");
   h4->Draw("box same");
}

Ok, I stood but this is not what I want. The plot is this one below:

I just want to have orbits in red.

It seems you draw the orbit with a TGraph ?
So you can do:

void boxsame6() {
   auto c = new TCanvas("c","Example of BOX plots with option Graph on top",200,10,700,500);
   TH2F *h1 = new TH2F("h1","h1",40,-3,3,40,-3,3);

   for (Int_t i=0;i<1000;i++) {
      double x,y;
      gRandom->Rannor(x,y);
      h1->Fill(x,y);
   }
   h1->SetLineColor(kBlue);
   h1->Draw("box");

   auto g  = new TGraph();
   g->SetMarkerStyle(20);
   g->AddPoint(-2,-2);
   g->AddPoint(0,0);
   g->AddPoint(2,2);
   g->SetMarkerColor(kRed);
   g->Draw("P");
}

Thanks couet and thanks everybody.
I solved just adding the “box” argument to the Draw() function!

This topic was automatically closed 14 days after the last reply. New replies are no longer allowed.