Hello,
when I try to set the grid in a TCanvas (TCanvas->SetGridY())
with the Y axis with logarithmic scale, sometimes I get a grid line for
each axis tick and sometime I get a grid line only for 10^N ticks
(and not for ticks corresponding to 2,3,4,5,6,7,8,9*10^N).
Why? What is the criterium and how can I change it?
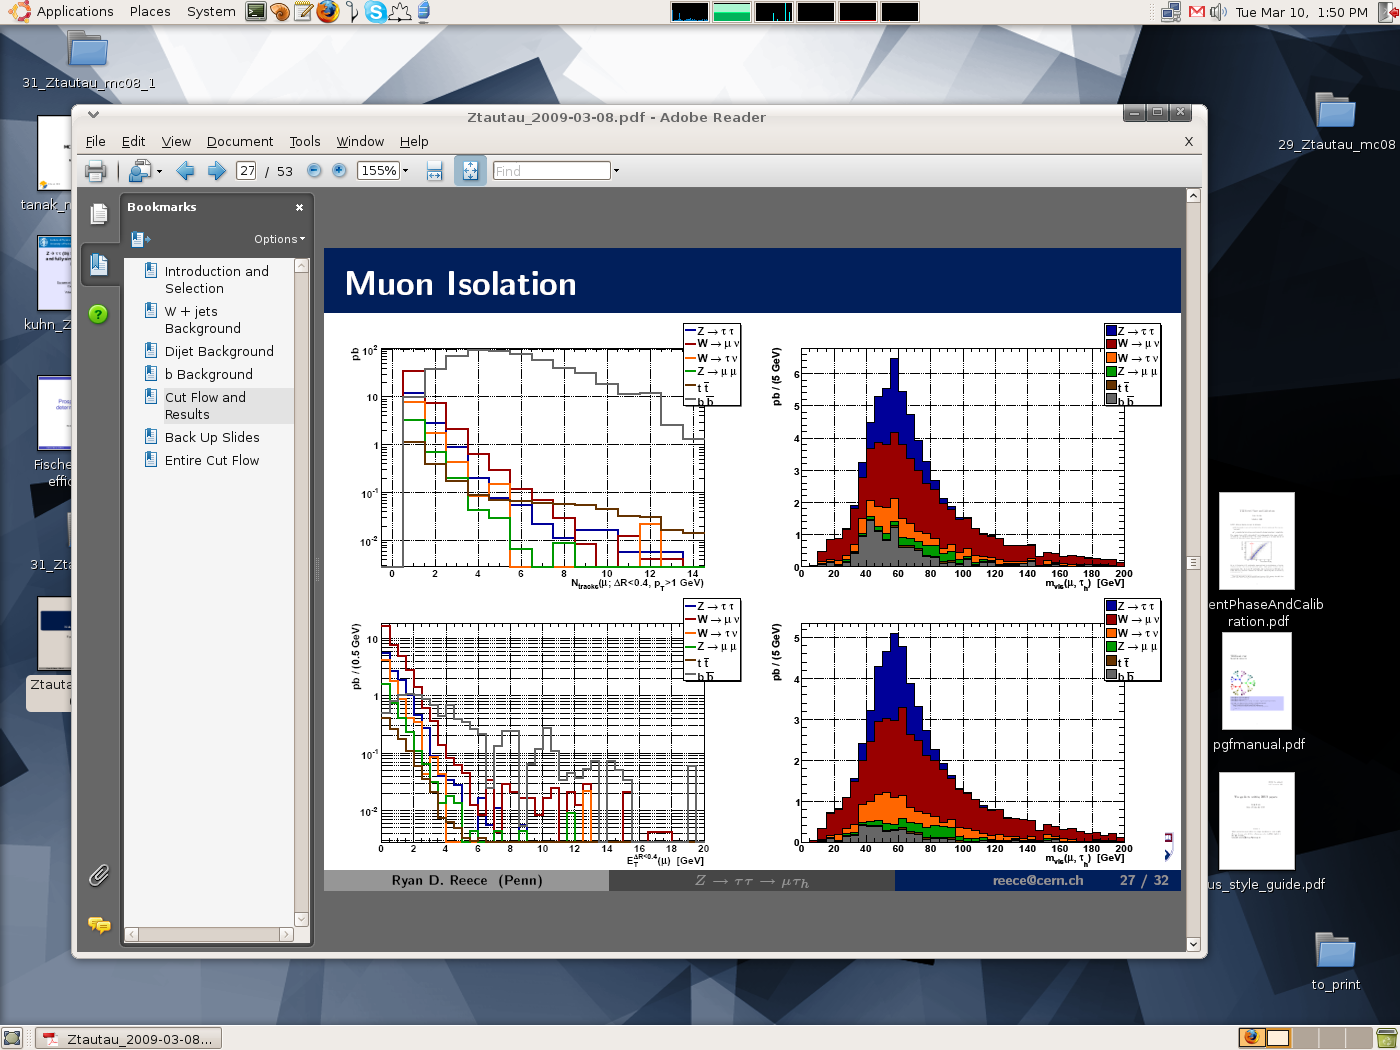
Could a flag be added so that the user can control this? In general I think only showing lines on the powers of 10 is usually preferred. Plots like my attached TauJet_Likelihood plot look much better than my attached TauJet_numTrack plot. The numTrack plot when scaled to be put in a talk or publication is nearly unreadable, but I would like to not have to give up the grid completely.
Or perhaps make the default that the grid is every decade when more than 1 or 2 decades are drawn (not 3). Perhaps make this the parameter that the user can tune.
Thanks.
–
Ryan D. Reece
Graduate Student
Experimental Particle Physics
The University of Pennsylvania hep.upenn.edu/~rreece/
I do not think changing 3 to 2 decades will make a difference. Then you will have people complaining that 2 is not enough.
Right now it is entirely automatic. Seems to me your 2 plots look good. If you remove the intermediate level on TauJet_numTrack_J-b-overlay.pdf it will look really empty.
I see 2 ways to answer your question:
we implement a new option…
you draw the grid yourself. In the case of TauJet_numTrack_J-b-overlay.pdf that will be only two line to draw. like that you put it where you want.
It would make a big difference. It would decrease the maximum number of grid lines in a plot by 10.
It looks fine when it is a eps/pdf displayed large on your screen, when it is scaled to fit with 3 other plots on a slide, or to a small box to fit in a publication, it looks terrible with all the grid lines going across. See attached screenshot.
The issue is that these plots are just a couple out of many plots that I make in a scripted way. It would be impractical to draw the grid by hand for every plot. It would be nice if the gridding were smart enough to never draw so many lines that it interferes with reading the plot.
No, it is not urgent. Being that it mainly aesthetic, I will be ok just turning the grid off for plots that I make on a log scale.
I am mainly trying to request a feature for new releases: a way to control the griding, or a smarter automatic griding. Initially I think a possible solution would be to allow the user to set the maximum number of decades drawn before grid lines are drawn only on the decades. This could just be an argument in canvas.SetGridy(3) would set that if 2 or more powers of 10 are drawn on the y-axis, then only draw a grid line every power of 10.
Did anything happen on that subject?
My search through the class references yielded nothing, so I guess one should still use a custom grid in this case?
Yes, definitely if it isn’t too much work. At the moment I don’t need it (built the grid manually), but I think that it would be useful in general (also for other users).