Miguel
December 18, 2023, 3:19pm
1
Hi all!
I have been trying to plot a TGraph but I keep failing. The idea is the following: we have two graphs, up and down, which are upper-lower limits. Between these lines, a median line is shown as well. My idea is to fill the area between the lower and upper limit with a “translucid” color. My script is the following:
void plotSolFlux(const Char_t* indir, const Char_t* outdir)
{
   TCanvas* c1=new TCanvas("c1","c1",500,400);

    TGraph* med = new TGraph();
    TGraph* up = new TGraph();
    TGraph* down = new TGraph();


    readAndFillGraphSXN(Form("%s/sun_med.txt", indir), med, 3);
    readAndFillGraphSXN(Form("%s/sun_max.txt", indir), down, 3);
    readAndFillGraphSXN(Form("%s/sun_min.txt", indir), up, 3);

    TMultiGraph* mg = new TMultiGraph();
    mg->SetMinimum(1e-11);
    mg->SetMaximum(1e-6);

    med->SetLineWidth(2);
    med->SetLineColor(1);
    med->SetLineStyle(2);

    down->SetLineWidth(2);
    down->SetLineColor(2);
    down->SetFillStyle(1001);
    down->SetFillColorAlpha(0.,0.5);

    up->SetLineWidth(2);
    up->SetLineColor(2);
    up->SetFillStyle(1001);
    up->SetFillColorAlpha(2, 0.5);

    mg->Add(med);
    mg->Add(up);
    mg->Add(down);
    mg->Draw("AL");

    mg->GetXaxis()->SetLabelSize(0.04);
    mg->GetYaxis()->SetLabelSize(0.04);
    mg->GetXaxis()->SetTitleSize(0.043);
    mg->GetYaxis()->SetTitleSize(0.043);
    mg->GetYaxis()->SetTitleOffset(1.2);

    mg->GetXaxis()->SetTitle("E [ GeV ]");
    mg->GetXaxis()->CenterTitle(true);
    mg->GetYaxis()->SetTitle("E^{3} #Delta#Omega_{Sun} #Phi_{#nu_{#mu}+#nu_{e}}  [ GeV^{2} cm^{-2} s^{-1} ]");
    mg->GetYaxis()->CenterTitle(true);

    mg->GetXaxis()->SetLimits(10,1e4);


    c1->SetLogx();
    c1->SetLogy();
    c1->SetGrid();
    c1->Print(Form("%s/solflux.pdf", outdir));

    return;
}
The function readAndFillGraphSXN just reads the .txt files and fills the histograms:
void readAndFillGraphSXN(const char* fileName, TGraph* graph, Int_t N) {
    std::ifstream file(fileName);
    Double_t x, y;
    Int_t i = 0;

    while (file >> x >> y) {
        graph->SetPoint(i++, x, pow(x,N)*y);
    }

    file.close();
}
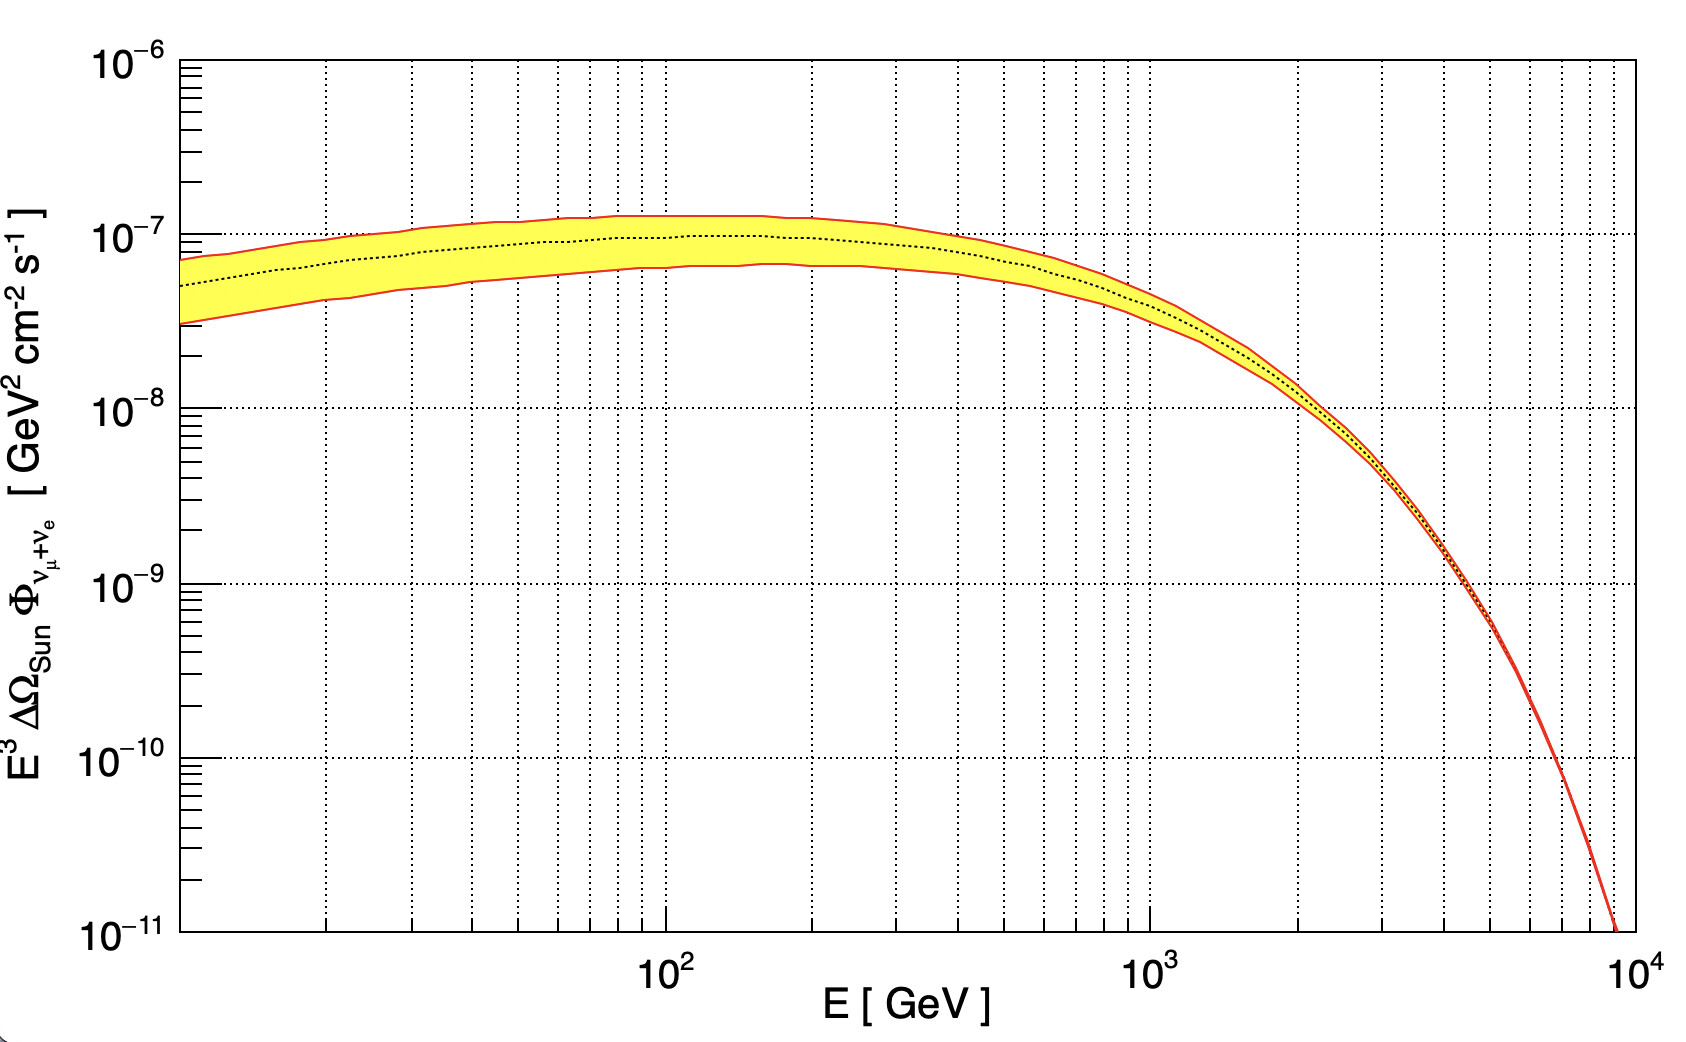
The output is exactly what I need… but without the filled area between up and down:solflux.pdf (15.4 KB)
Any ideas on what’s going on here?
Thanks in advance!
couet
December 18, 2023, 3:55pm
2
Can I have the .txt files to try your macro ?
I think you’re on the right track. However, the issue you’re facing with SetFillColorAlpha not working as expected might be related to a couple of factors.
I’d recommend to ensure that your ROOT environment is set up to support transparency. Transparency in ROOT is available on all platforms if the OpenGL.CanvasPreferGL flag is set to 1 in $ROOTSYS/etc/system.rootrc. For Mac users, this should work with the Cocoa backend as well. However, note that X11 does not support transparency, which might be a limitation if you’re using it.
In your script, you used SetFillColorAlpha with the parameters (2, 0.5) and (0., 0.5). The alpha value (second parameter) ranges from 0 (fully transparent) to 1 (completely opaque). Ensure that the first parameter, which represents the color index, is set to a valid value as per your requirements. You can refer to the ROOT documentation or tutorials for more examples of using color transparency effectively.
Miguel
December 18, 2023, 4:04pm
4
Sure!
Sun_max.txt (2.7 KB)Sun_med.txt (2.7 KB)Sun_min.txt (2.7 KB)
Thanks in advance!
Dilicus
December 18, 2023, 4:06pm
5
Hi @Miguel ,f in the draw instruction.
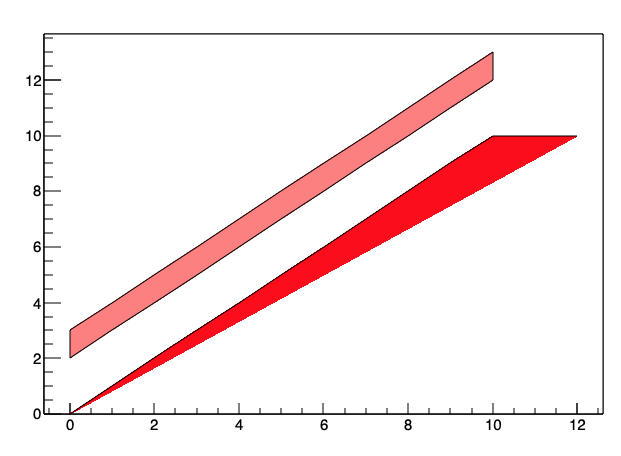
Moreover if you want to fill the area between 2 curves is better to define a single graph, otherwise root will fill the area closing the graph between your first and last point.
I produced a little macro to explain my point, I also attached a screenshot and the
pdf I obtained after saving the file.
{

    TGraph *gr_open_line = new TGraph();


    TGraph *gr_closed_line = new TGraph();


    for(int i=0; i<=10; i++)
        gr_open_line->SetPoint(gr_open_line->GetN(),i,i);

    gr_open_line->SetPoint(gr_open_line->GetN(),12,10);

    for(int i=0; i<=10; i++)
        gr_closed_line->SetPoint(gr_closed_line->GetN(),i,i+2);

    for(int i=10; i>=0; i--)
        gr_closed_line->SetPoint(gr_closed_line->GetN(),i,i+3);

    gr_closed_line->SetPoint(gr_closed_line->GetN(),gr_closed_line->GetPointX(0),gr_closed_line->GetPointY(0));

    gr_open_line->GetXaxis()->SetRangeUser(-4,15);
    gr_open_line->GetYaxis()->SetRangeUser(-2,15);


    gr_open_line->SetFillColor(kRed);
    gr_closed_line->SetFillColor(kRed);

    TMultiGraph* mg = new TMultiGraph();
    mg->Add(gr_open_line);
    mg->Add(gr_closed_line);
    mg->Draw("alf");


}
c1.pdf (13.2 KB)
couet
December 18, 2023, 4:13pm
6
Thanks, give me a bit of time and I’ll will send you back the working macro.
couet
December 18, 2023, 4:31pm
7
void readAndFillGraphSXN(const char* fileName, TGraph* graph, Int_t N) {
    std::ifstream file(fileName);
    Double_t x, y;
    Int_t i = 0;

    while (file >> x >> y) {
        graph->SetPoint(i++, x, pow(x,N)*y);
    }

    file.close();
}

void plotSolFlux(const Char_t* indir, const Char_t* outdir)
{
   TCanvas* c1=new TCanvas("c1","c1",500,400);

    TGraph* med = new TGraph();
    TGraph* up = new TGraph();
    TGraph* down = new TGraph();

    readAndFillGraphSXN(Form("%s/sun_med.txt", indir), med, 3);
    readAndFillGraphSXN(Form("%s/sun_max.txt", indir), down, 3);
    readAndFillGraphSXN(Form("%s/sun_min.txt", indir), up, 3);

    TMultiGraph* mg = new TMultiGraph();
    mg->SetMinimum(1e-11);
    mg->SetMaximum(1e-6);

    med->SetLineWidth(2);
    med->SetLineColor(1);
    med->SetLineStyle(2);

    down->SetLineWidth(2);
    down->SetLineColor(2);

    up->SetLineWidth(2);
    up->SetLineColor(2);

    // Merge up and down to make the filled part
    TGraph* fill = new TGraph();
    fill->SetFillColor(kYellow);
    int i;
    for (i=0; i<down->GetN();i++) fill->AddPoint(down->GetPointX(i), down->GetPointY(i));
    for (i=up->GetN(); i>=0; i--) fill->AddPoint(up->GetPointX(i)  , up->GetPointY(i));

    mg->Add(fill,"F");
    mg->Add(med);
    mg->Add(up);
    mg->Add(down);
    mg->Draw("AL");

    mg->GetXaxis()->SetLabelSize(0.04);
    mg->GetYaxis()->SetLabelSize(0.04);
    mg->GetXaxis()->SetTitleSize(0.043);
    mg->GetYaxis()->SetTitleSize(0.043);
    mg->GetYaxis()->SetTitleOffset(1.2);

    mg->GetXaxis()->SetTitle("E [ GeV ]");
    mg->GetXaxis()->CenterTitle(true);
    mg->GetYaxis()->SetTitle("E^{3} #Delta#Omega_{Sun} #Phi_{#nu_{#mu}+#nu_{e}}  [ GeV^{2} cm^{-2} s^{-1} ]");
    mg->GetYaxis()->CenterTitle(true);

    mg->GetXaxis()->SetLimits(10,1e4);

    c1->SetLogx();
    c1->SetLogy();
    c1->SetGrid();
    c1->Print(Form("%s/solflux.pdf", outdir));
}
Miguel
December 18, 2023, 4:40pm
8
couet:
void readAndFillGraphSXN(const char* fileName, TGraph* graph, Int_t N) {
    std::ifstream file(fileName);
    Double_t x, y;
    Int_t i = 0;

    while (file >> x >> y) {
        graph->SetPoint(i++, x, pow(x,N)*y);
    }

    file.close();
}

void plotSolFlux(const Char_t* indir, const Char_t* outdir)
{
   TCanvas* c1=new TCanvas("c1","c1",500,400);

    TGraph* med = new TGraph();
    TGraph* up = new TGraph();
    TGraph* down = new TGraph();

    readAndFillGraphSXN(Form("%s/sun_med.txt", indir), med, 3);
    readAndFillGraphSXN(Form("%s/sun_max.txt", indir), down, 3);
    readAndFillGraphSXN(Form("%s/sun_min.txt", indir), up, 3);

    TMultiGraph* mg = new TMultiGraph();
    mg->SetMinimum(1e-11);
    mg->SetMaximum(1e-6);

    med->SetLineWidth(2);
    med->SetLineColor(1);
    med->SetLineStyle(2);

    down->SetLineWidth(2);
    down->SetLineColor(2);

    up->SetLineWidth(2);
    up->SetLineColor(2);

    // Merge up and down to make the filled part
    TGraph* fill = new TGraph();
    fill->SetFillColor(kYellow);
    int i;
    for (i=0; i<down->GetN();i++) fill->AddPoint(down->GetPointX(i), down->GetPointY(i));
    for (i=up->GetN(); i>=0; i--) fill->AddPoint(up->GetPointX(i)  , up->GetPointY(i));

    mg->Add(fill,"F");
    mg->Add(med);
    mg->Add(up);
    mg->Add(down);
    mg->Draw("AL");

    mg->GetXaxis()->SetLabelSize(0.04);
    mg->GetYaxis()->SetLabelSize(0.04);
    mg->GetXaxis()->SetTitleSize(0.043);
    mg->GetYaxis()->SetTitleSize(0.043);
    mg->GetYaxis()->SetTitleOffset(1.2);

    mg->GetXaxis()->SetTitle("E [ GeV ]");
    mg->GetXaxis()->CenterTitle(true);
    mg->GetYaxis()->SetTitle("E^{3} #Delta#Omega_{Sun} #Phi_{#nu_{#mu}+#nu_{e}}  [ GeV^{2} cm^{-2} s^{-1} ]");
    mg->GetYaxis()->CenterTitle(true);

    mg->GetXaxis()->SetLimits(10,1e4);

    c1->SetLogx();
    c1->SetLogy();
    c1->SetGrid();
    c1->Print(Form("%s/solflux.pdf", outdir));
Yes, that totally worked!
Thanks a lot.
And thanks to the other answers as well, I was checking your comments carefully.
Thanks to everyone for your help again!
Best regards,