Hi,
I have the following code:
rfile = TFile(file_dir)
histogram = rfile.Get(hist_name)
canvas = TCanvas("canvas", "canvas", 1000, 600)
histogram.GetXaxis().SetTitle("M_0")
histogram.GetYaxis().SetTitle("M_1/2")
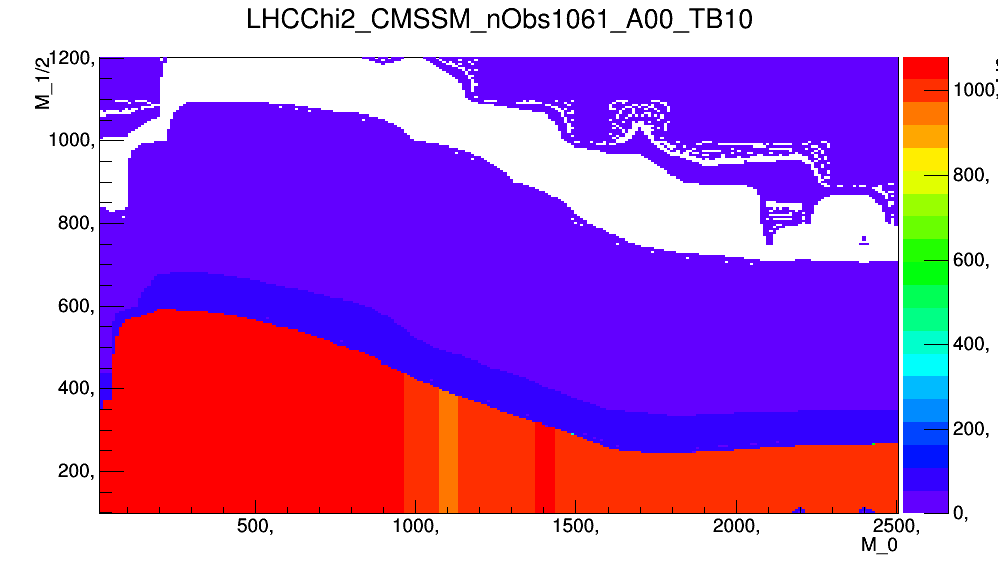
histogram.GetZaxis().SetTitle("chi2")
histogram.Draw("COLZ")
ROOT.gPad.Update()
ROOT.gStyle.SetOptStat(0)# Do not print the stat box
canvas.Print("./data.png")But I cannot see the “chi2” title for the COLZ palette on the right side
Anyone has an idea how to solve this?
Jan