I have a multigraph to which I add many TGraphs with a mouse click. each time I add a new graph the multigraph rescales to the actual graph. Therefore, if the maximum y-value of the new graph is much smaller, the other graphs almost disapear into the upper part of the y-axis.
How can I determine the maximum of all maxima of each TGraph the multigraph contains and then appropriately rescale the multigraph?
Ok, the user add the graphs by pushing a button with the mouse
The script reads files creats TGraphs and adds them to a multigraph.
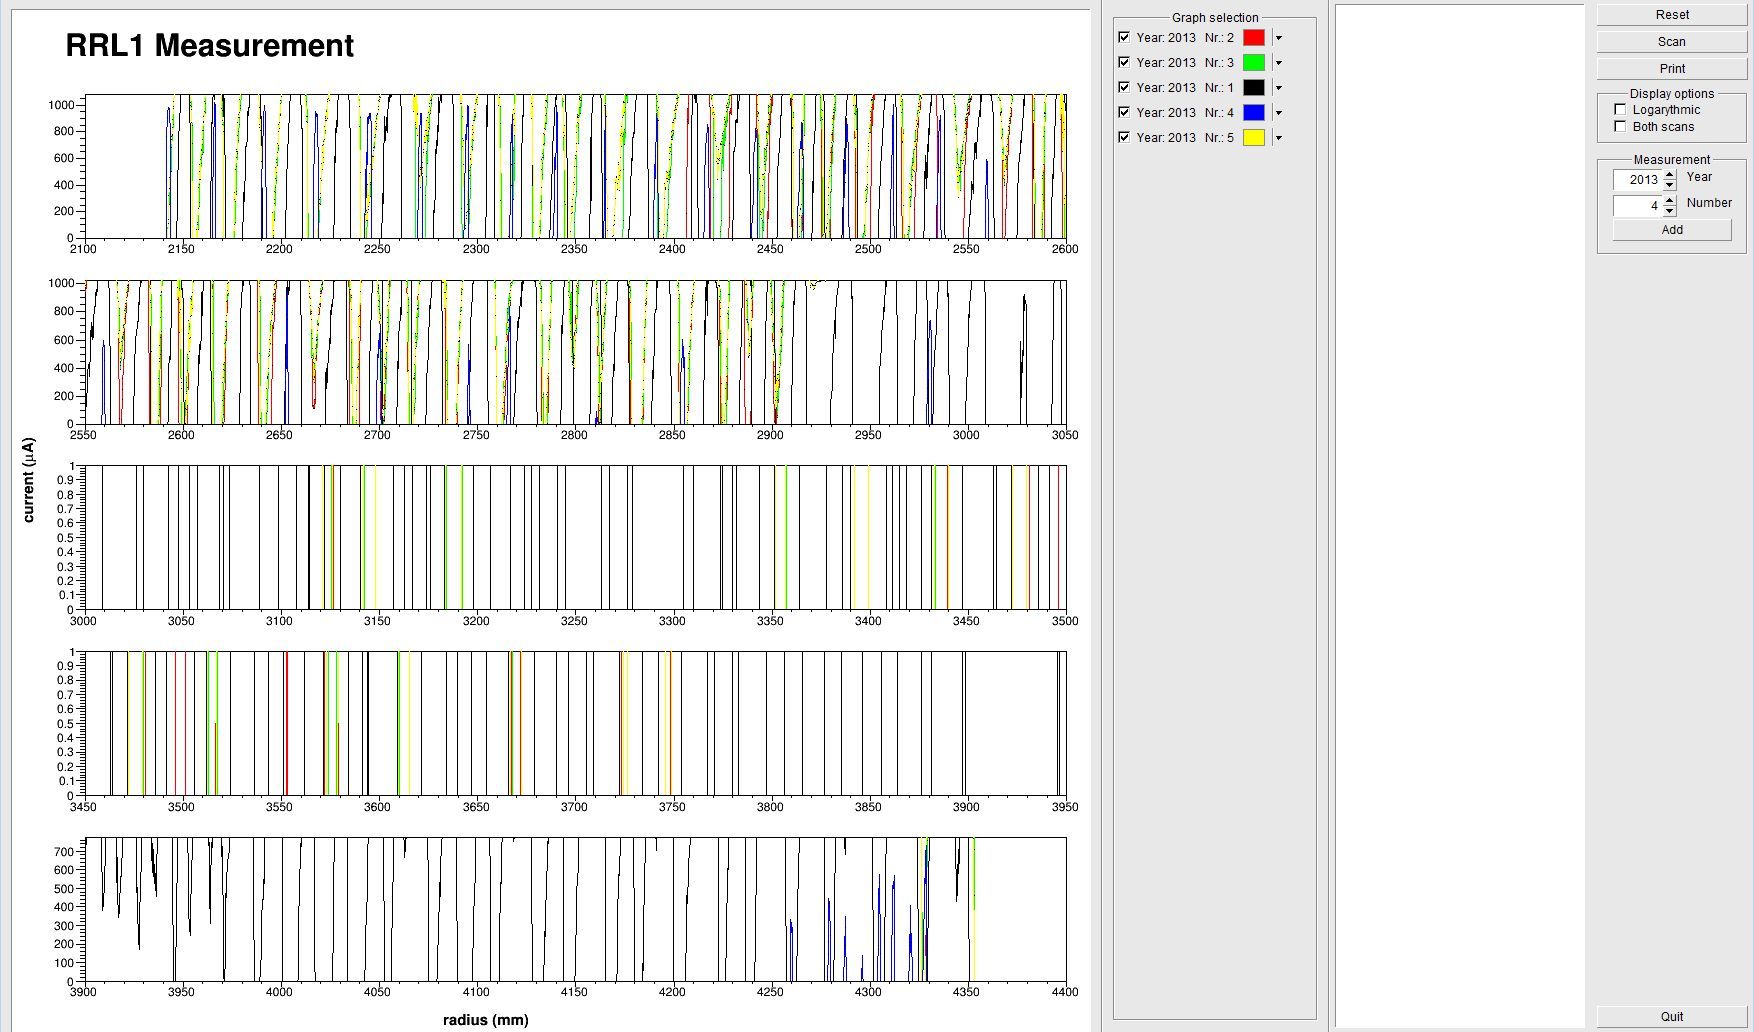
As you can see on the picture the scale is set to the last graph loaded, in this case the one with the smallest maximum (the blue one).
As I said the Multigraph does it itself each time you draw it … you have nothing to do … Something should be wrong in your code … what happens if you try to change the graphics window size with the mouse ? does it update the plots ?
Actually, I set the pad no editable after I added graphs and updated the canvas. But I tried and the graphs indeed rescale.
What I would like is, that the user can only change the scale with the mouse (zoom in or out) but not enlarge it or accidantly move the pad/the graph around. What usually happens is that people click into the graphs and everything is messed up.
So half of the problem is solved when I change the order of setting editable, updating, adding aso.
Still I would be interested to find the maximum of all graphs. I guess I have to go through all of them.