Semi-transparent TH2F over TImage (is it possible?)

Hi Folks – I’ve looked around and tried a few things, but I haven’t been able to figure out how to do this.

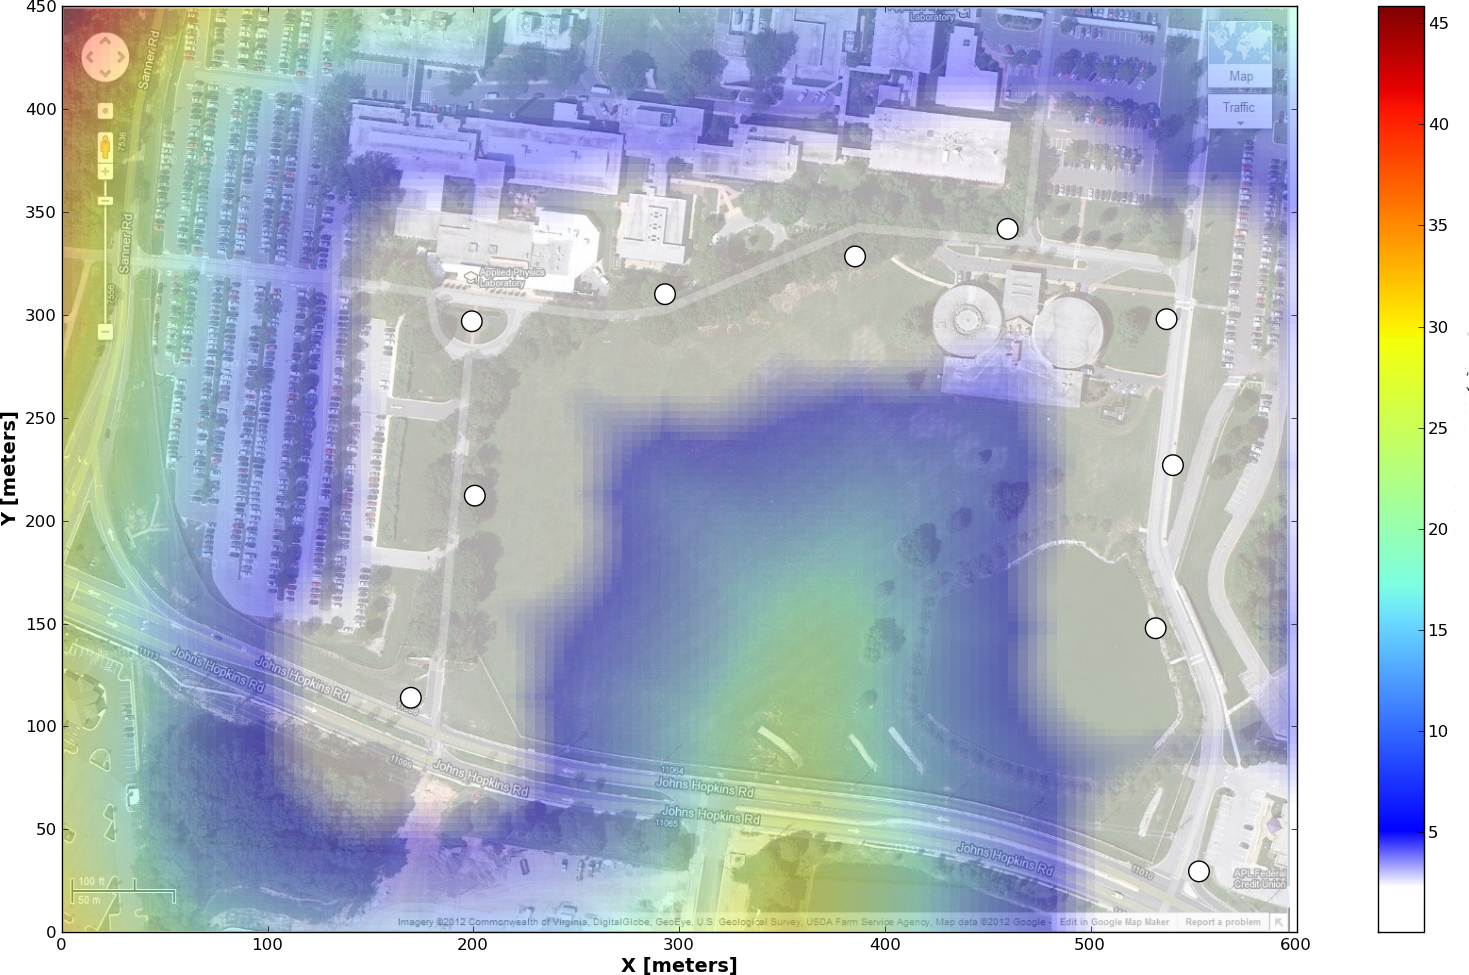
I would like to plot a TH2F histogram in a pad over top of a (for instance) a TImage imported from Google maps. I’ve been able to do something like this by exporting my TH2F to matplotlib (which i’ve attached), but I would like to use the interactive capabilities of a ROOT canvas to do further analysis that I don’t know how to do with matplotlib.

I’ve tried creating a transparent pads (one with the image, and one with the histogram) but the histogram completely obscures the image.

Anyone know the best way to do this (if it is even possible?)

Thanks,
Brian


ROOT now support transparency in PNG files. That’s still not done for a complete color map but you can easily loop on all the colors in the map to make them transparent (by the way making a complete map transparent is a nice extension to add to TPaletteAxis). The following example shows you how to make a color transparent:

void transparency()
{
   TCanvas *c = new TCanvas();

   TH1F *th1f_1 = new TH1F("hpt1", "Distribution of pT;pT;Events", 40, 0, 8);
   TH1F *th1f_2 = new TH1F("hpt2", "Distribution of pT;pT;Events", 40, 0, 8);
   TRandom r;
   for (Int_t i=0; i<2500; i++) {
      th1f_1->Fill(r.Gaus(4, 1.));
      th1f_2->Fill(r.Gaus(6, 1.));
   }
   th1f_1->SetStats(0);
   gStyle->SetTitleFont(132.," ");
   th1f_1->GetYaxis()->SetTitleFont(132);
   th1f_1->GetYaxis()->SetLabelFont(132);
   th1f_1->GetYaxis()->SetNdivisions(9);
   th1f_1->GetYaxis()->SetTickLength(0.01);
   th1f_1->GetYaxis()->SetTitleSize(0.04);
   th1f_1->GetYaxis()->CenterTitle(true);
   th1f_1->GetXaxis()->SetNdivisions(9);
   th1f_1->GetXaxis()->CenterTitle(true);
   th1f_1->GetXaxis()->SetTitleFont(132);
   th1f_1->GetXaxis()->SetLabelFont(132);
   th1f_1->GetXaxis()->SetTickLength(0.01);
   th1f_1->GetXaxis()->SetTitleSize(0.04);


   Int_t ci1 = TColor::GetColor("#99cc99");
   TColor *col1 = gROOT->GetColor(ci1);
   col1->SetAlpha(0.3);
   th1f_1->SetFillColor(ci1);

   Int_t ci2 = TColor::GetColor("#cc9999");
   TColor *col2 = gROOT->GetColor(ci2);
   col2->SetAlpha(0.3);
   th1f_2->SetFillColor(ci2);

   th1f_1->Draw();
   th1f_2->Draw("same");

   TLegend *leg = new TLegend(0.1206897,0.7288136,0.3591954,0.8728814,NULL,"brNDC");
   leg->SetBorderSize(1);
   leg->SetLineColor(1);
   leg->SetLineStyle(1);
   leg->SetLineWidth(1);
   leg->SetFillStyle(0);
   leg->SetTextFont(12);
   leg->AddEntry(th1f_1,"Z #rightarrow #it{#mu#mu}","f");
   leg->AddEntry(th1f_2,"t#bar{t}","f");
   leg->Draw();

   c->Print("transparency.png");
}

By the way regarding the rainbow color, see: root.cern.ch/drupal/content/rainbow-color-map

Thanks for the example.

However, I’m looking for the transparency to show up while in the canvas. I’m essentially geo-referencing a 2D histogram to a map image from google maps.

I’d like to be able to draw cuts (TCutG) in the canvas based on guidance from the underlying map image (for instance I have a constraint that a cut boundary cannot cross a road) which means being able to zoom-in and zoom-out using the axes and having both the map image and the 2-D histogram scale.

I haven’t quite figured out how to do that. Is transparancy possible in a TCanvas?

Also, I agree whole-heartedly about the dangers of the rainbow color scale, both for the reasons given in your document and for the difficulties that arise for color-blind people like me. Thanks for the reference.

It is possible only on Mac with the native cocoa/quartz implementation.

I am now trying to investigate if the TASimage class (used to produce png files) can be also you to render graphics in the canvas.